“(Factor, Factor), gimme the news
I got a bad case of lovin’ you
No pill’s gonna cure my ill
I got a bad case of lovin’ you… “
(ADAPTED FROM “BAD CASE OF LOVING YOU (DOCTOR, DOCTOR),” BY ROBERT PALMER, 1979)
By Scott Welch, CIMA®, Chief Investment Officer & Partner
Reviewed by Carter Mecham, CMA®, IACCP®
Regular readers know we are firm advocates of both asset class and risk factor diversification. Regular readers know we are firm advocates of both asset class and risk factor diversification. We believe that using both leads to better diversification and, therefore, more consistent portfolio performance regardless of the underlying market regime.
So, we believe it appropriate to periodically check in on risk factor performance, as it tends to be less well-covered than its more famous cousin: asset class.
Let’s dive in.
Growth & Momentum: Losing Steam?
First, let’s look at the US large cap risk factor performance over the past two years.
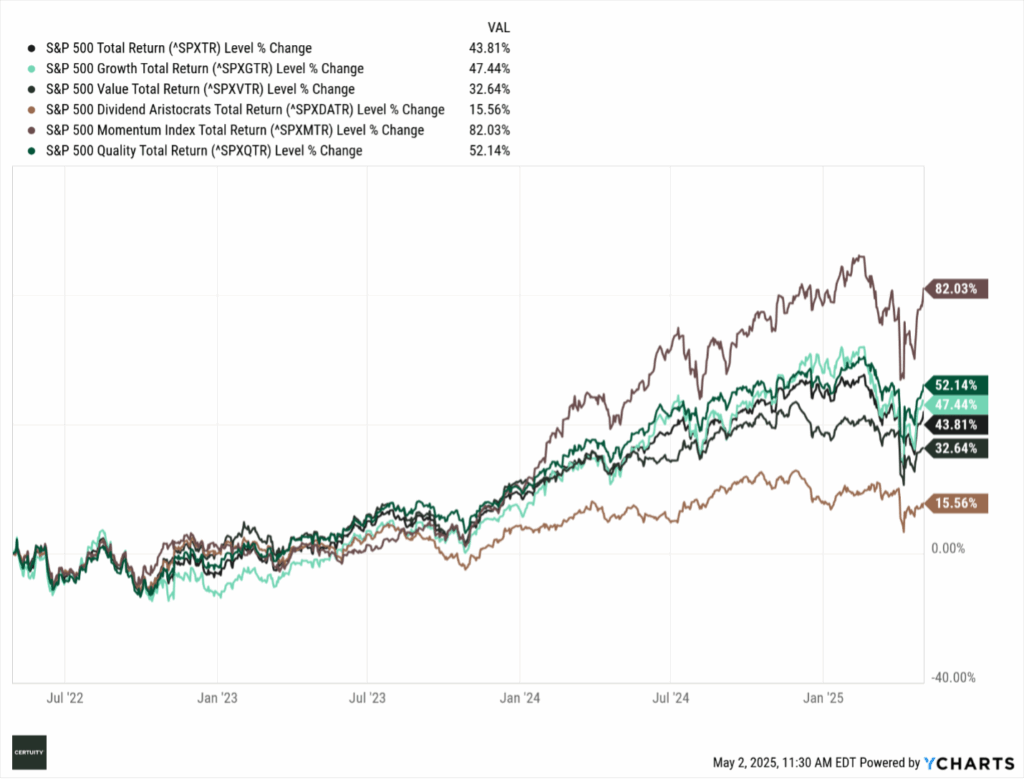
Source: Ycharts, 2-year data through May 1, 2025. You cannot invest in an index and past performance is no guarantee of future results.
We see that the growth and momentum factors dominated performance (though note quality’s consistent performance – more on that later), which is no surprise given the commanding dominance of the “mega-cap tech” stocks. We also point out how much influence these two factors had on the overall S&P 500 index performance.
But how are we doing this year? Things have changed (at least for now) – momentum remains the leading risk factor, but growth has certainly faded, and value seems to be regaining ground. And we view momentum as a derivative risk factor – if anything is running then momentum will as well. We also note that quality just continues to chug along.
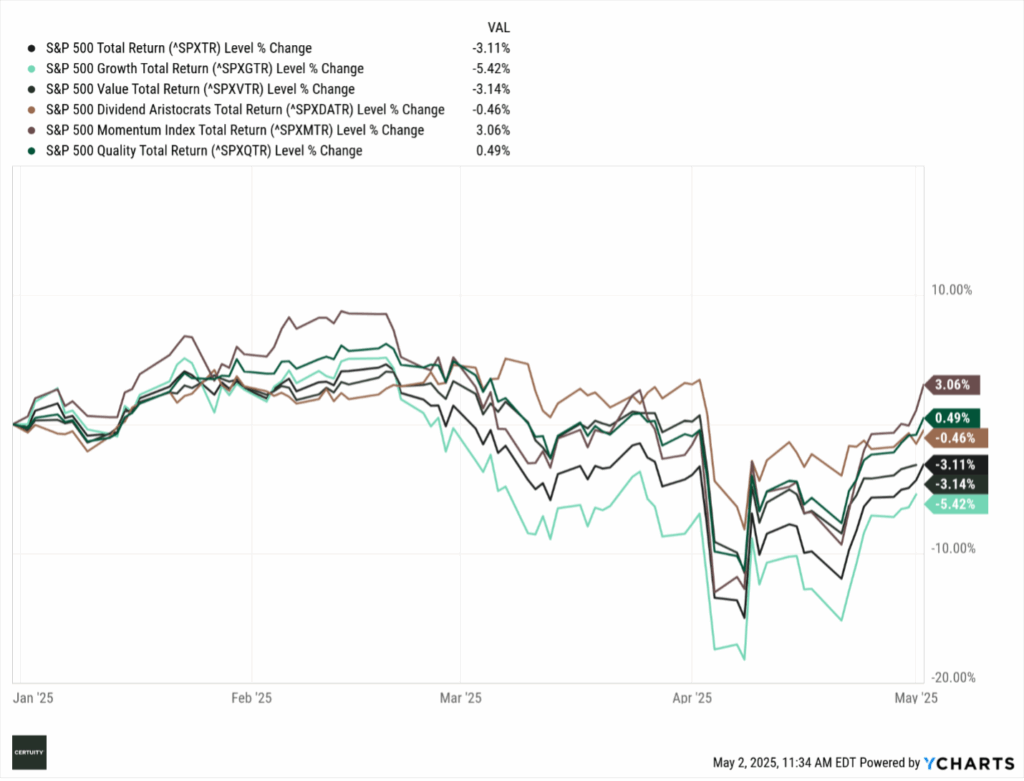
Source: Ycharts, YTD data through May 1, 2025. You cannot invest in an index and past performance is no guarantee of future performance.
As a reminder, and using the “DuPont Analysis,”[1] quality can be defined as companies with stronger balance sheets, earnings, and cash flows, and therefore better ability to maintain or grow dividends, engage in buybacks, and/or maintain margins during economic or market downturns.
We can see the YTD trend reversal if we look at the S&P 500 performance versus the Equal-Weighted S&P 500 performance. The latter removes the market capitalization dominance of the mega-cap tech stocks and so gives greater prominence to the smaller cap stocks within the overall index.
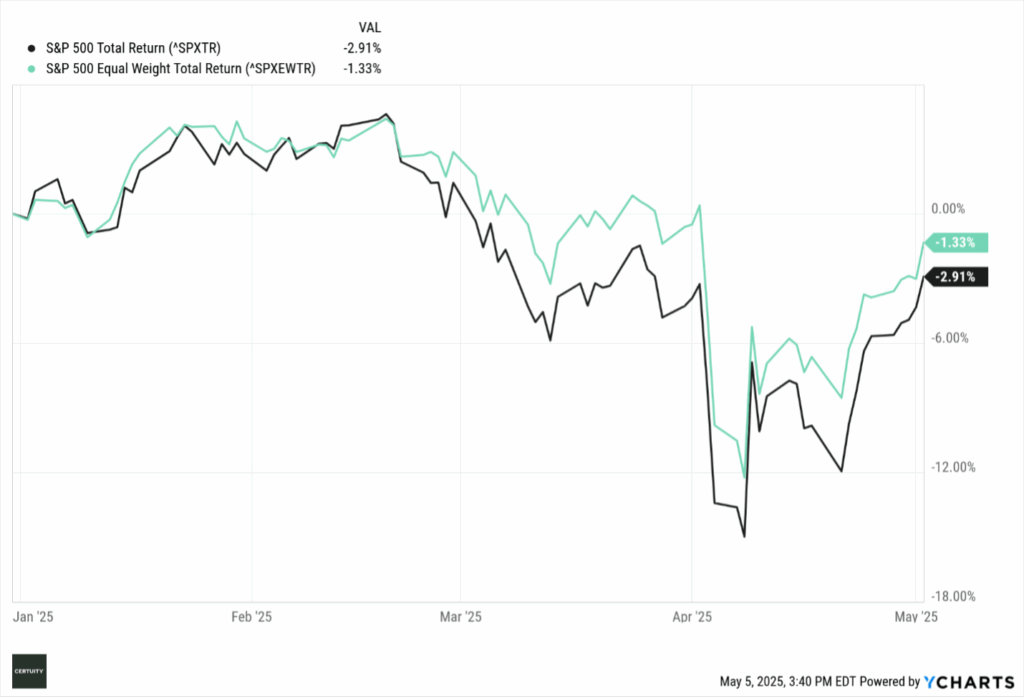
Source: Ycharts, YTD data through May 2, 2025. You cannot invest in an index and past performance is no guarantee of future results.
SMID cap stocks have underperformed overall due to (we believe) uncertainty over future economic conditions, interest rates, and tariff policies – all of which SMID cap stocks are more sensitive to. We like SMID cap stocks from a long-term strategic perspective but believe it may be a little too soon to lean into those asset classes.
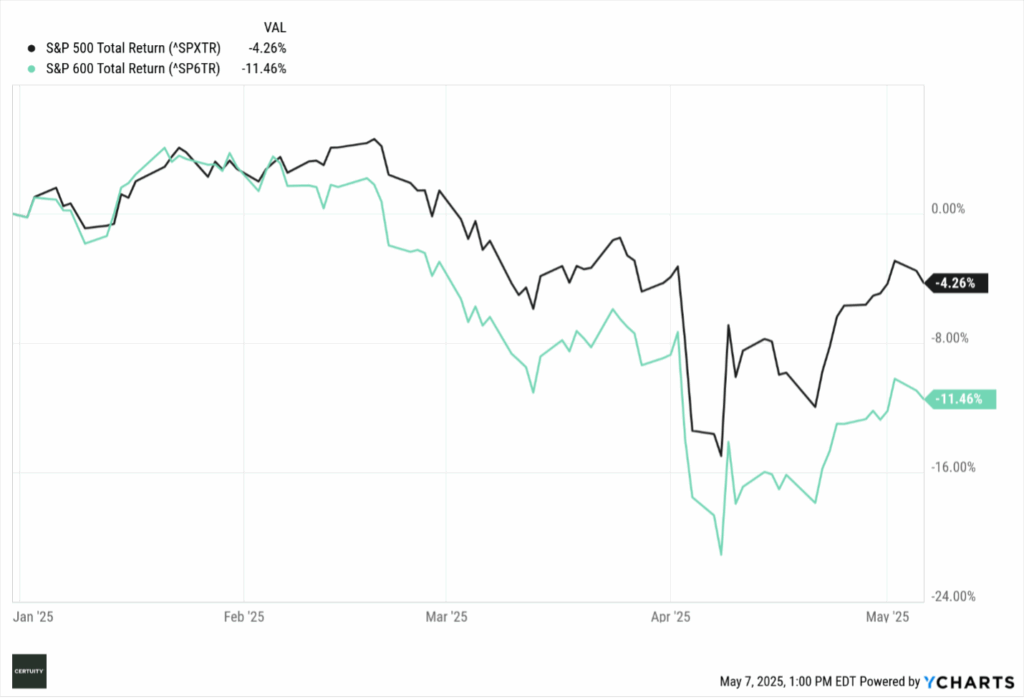
Source: Ycharts, YTD data through May 6, 2025. You cannot invest in an index and past performance is no guarantee of future results.
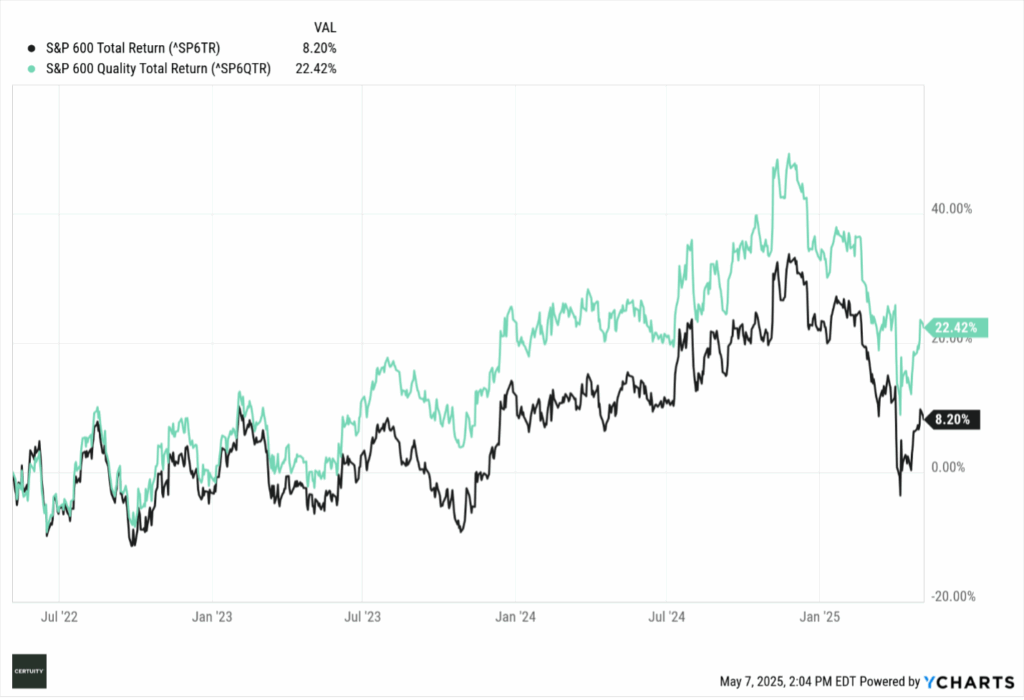
But if we compare just SMID factor risk performances, we see that quality has led the pack over the past three years.

Source: Ycharts, 3-year data through May 2, 2025. You cannot invest in an index and past performance is no guarantee of future results.
Value and Dividend: The New Outperformers
Let’s next dive a little deeper into the value and dividend factors. As long-term, fundamentally driven investors, we believe that quality, size, value, and dividends can deliver excess performance over time, and historically that has been true.
If we look at the dividend and value factors in large cap, we see an interesting story so far this year. While all the factors are underwater, dividends and value are outperforming growth and the overall S&P 500 index (which, as we noted above, is heavily influenced by growth stocks).
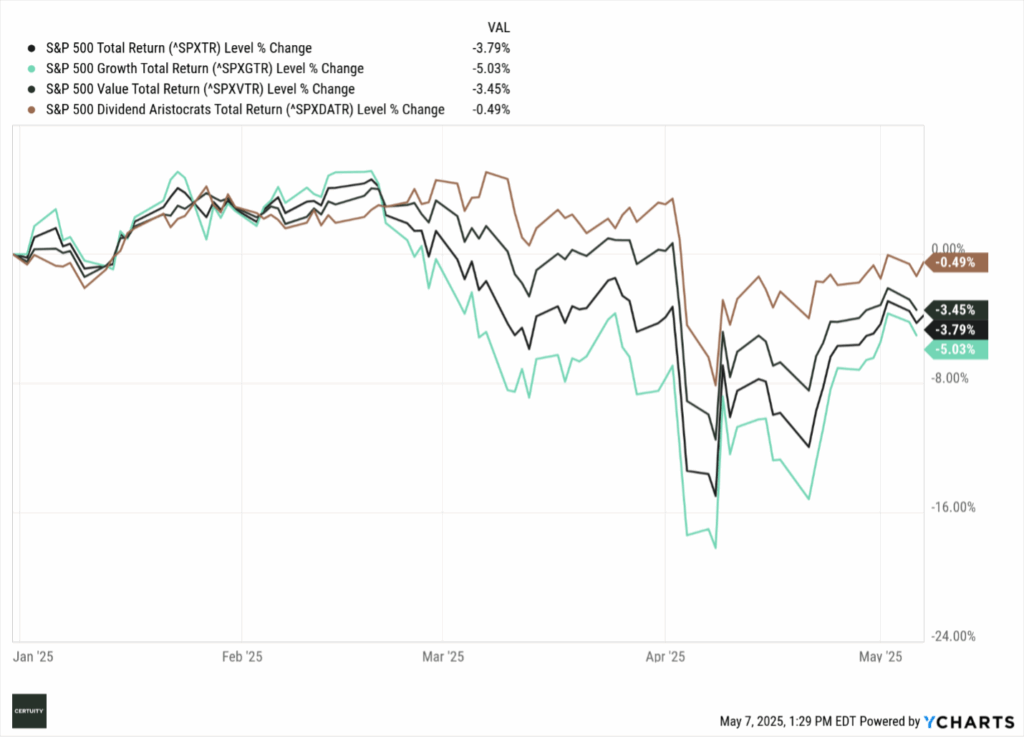
Source: Ycharts, YTD data through May 6, 2025. You cannot invest in an index and past performance is no guarantee of future results.
Given the dramatic valuation differentials between these factors (focusing on value and size) and the growth factor, patient investors should be rewarded over time by not ignoring these types of stocks – but it may take some time. As mentioned, we think it is too soon to lean into SMID cap stocks, but stay tuned pending economic, interest rate, and tariff outcomes.
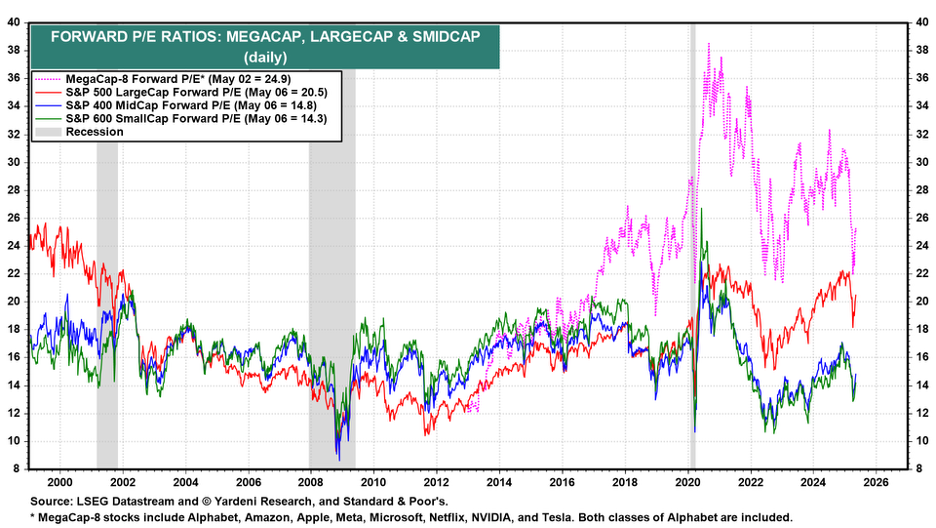
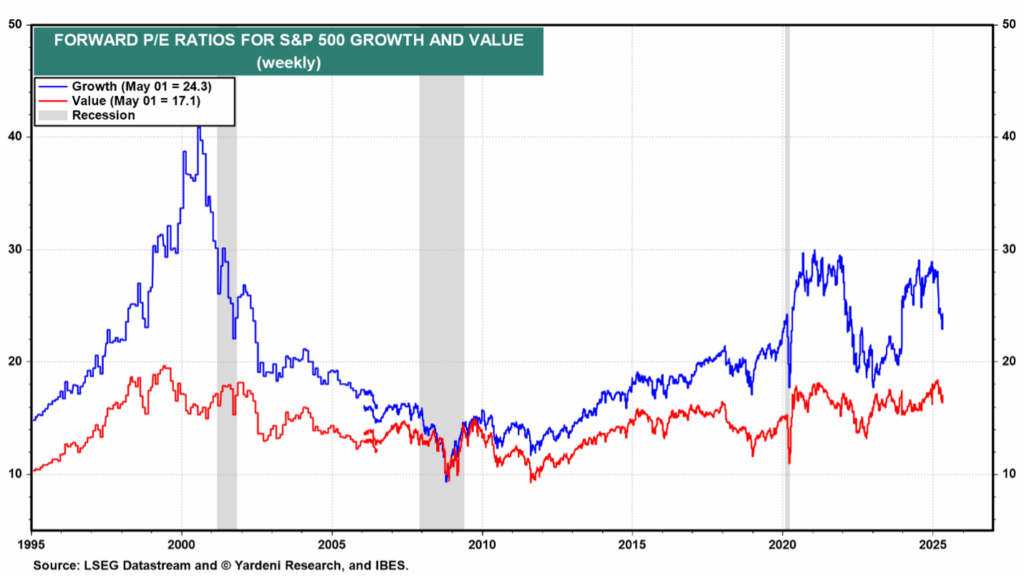
Source for both charts: Yardeni Research, through April 2025. You cannot invest in an index and past performance is no guarantee of future results.
Quality: The Consistent One
Now let’s go back to the quality factor, first within large cap stocks.
We use 3-year data to capture the relative performance during the dismal calendar year of 2022. Note that, despite the general dominance of the growth factor, quality has outperformed over the past three years.
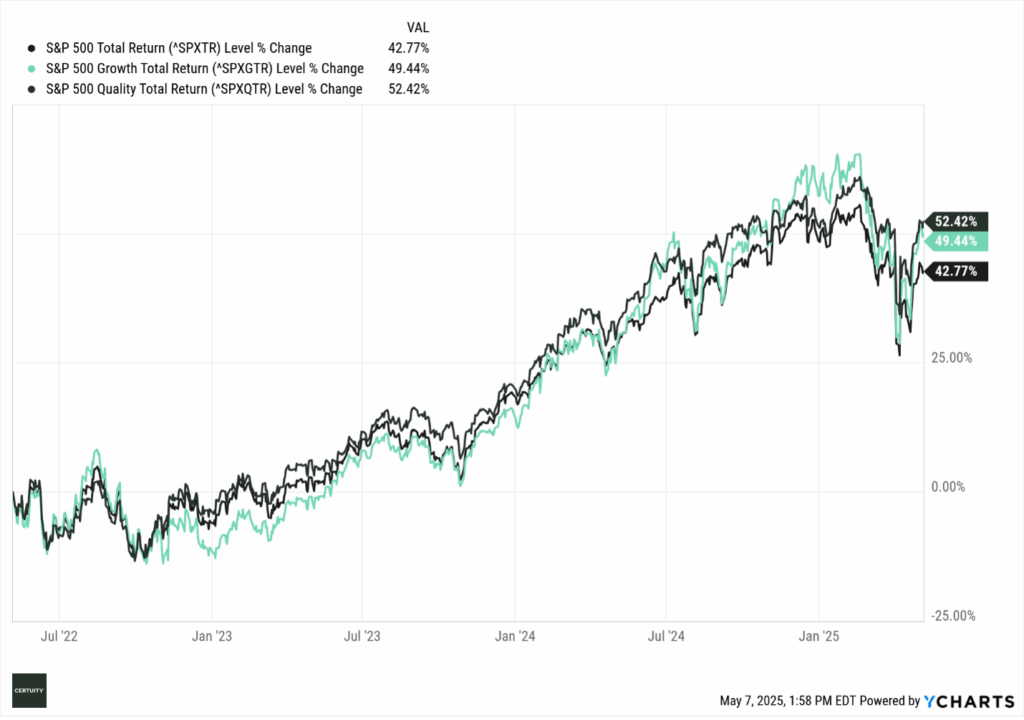
Source: Ycharts, 3-year data through May 6, 2025. You cannot invest in an index and past performance is no guarantee of future results.
Now look at SMID cap performances, where we illustrate the outperformance of the quality factor by comparing the relative performances of the S&P 600 vs. the S&P 600 Quality indexes.
Source: Ycharts, 3-year data through May 6, 2025. You cannot invest in an index and past performance is no guarantee of future results.
All the above charts illustrate the cumulative performance of the distinct factors across the defined time horizons. We think they also usefully illustrate how the factors performed through time in terms of generating (or not) excess performance relative to a broader cap-weighted benchmark.
The following is a busy chart but focus on the dark green line – quality. You will see it is rarely the best but also neither the worst performing factor – it simply is the most consistent, which allows it to outperform cumulatively over time. Remember the quote attributed to Albert Einstein – “compound interest is the most powerful force in the universe”.
Note the consistency as well of the “factor mix” performance (lighter blue line) – which supports our argument for risk factor diversification.
To paraphrase the old line about how to get to Carnegie Hall (“Practice, Practice, Practice”), with respect to long-term investing it is, “Consistency, Consistency, Consistency.”
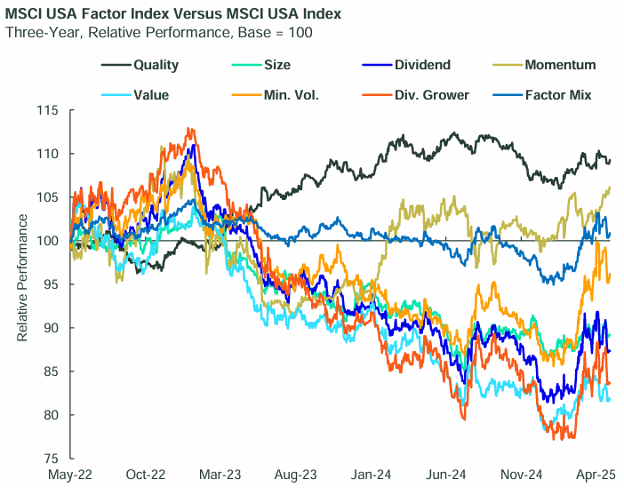
Source: State Street Global Advisors “SPDR® ETF Chart Pack” and Bloomberg Finance, L.P., 3-year performance as of April 30, 2025. You cannot invest in an index and past performance is no guarantee of future results. Min. Vol = MSCI USA Minimum Volatility Index | Value = MSCI USA Enhanced Value Index | Quality = MSCI USA Quality Index | Size = MSCI USA Equal Weighted Index | Dividend = MSCI USA High Dividend Yield Index | Momentum = MSCI USA Momentum Index | Factor Mix = MSCI USA Factor Mix A-Series Capped Index. Div. Grower = S&P High Yield Dividend Aristocrats Index. The indexes used above were compared to the MSCI USA Index. Index returns are unmanaged and do not reflect the deduction of any fees or expenses. Index returns reflect all items of income, gain and loss and the reinvestment of dividends and other income as applicable. All the index performance results referred to are provided exclusively for comparison purposes only. It should not be assumed that they represent the performance of any particular investment.
Summary and Interpretation
Let’s conclude by reminding ourselves of why asset classdiversification is so important, using the well-known asset class “performance quilt.”
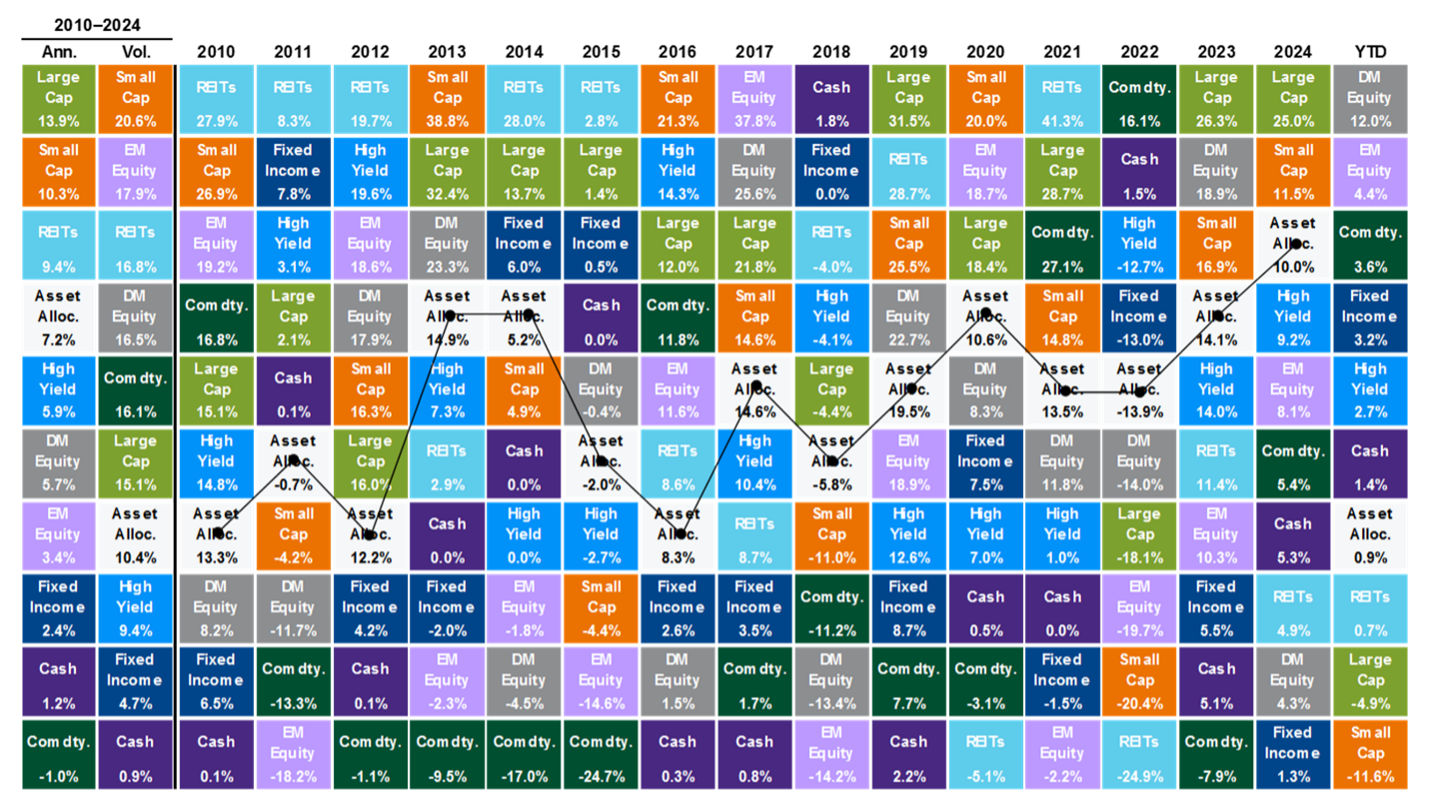
Source: Bloomberg, FactSet, MSCI, NAREIT, Russell, Standard & Poor’s, J.P. Morgan Asset Management. Large cap: S&P 500, Small cap: Russell 2000, EM Equity: MSCI EME, DM Equity: MSCI EAFE, Comdty: Bloomberg Commodity Index, High Yield: Bloomberg Global HY Index, Fixed Income: Bloomberg US Aggregate, REITs: NAREIT Equity REIT Index, Cash: Bloomberg 1-3m Treasury. The “Asset Allocation” portfolio assumes the following weights: 25% in the S&P 500, 10% in the Russell 2000, 15% in the MSCI EAFE, 5% in the MSCI EME, 25% in the Bloomberg US Aggregate, 5% in the Bloomberg 1-3m Treasury, 5% in the Bloomberg Global High Yield Index, 5% in the Bloomberg Commodity Index and 5% in the NAREIT Equity REIT Index. Balanced portfolio assumes annual rebalancing. Annualized (Ann.) return and volatility (Vol.) represents period from 12/31/2009 to 12/31/2024. All data represent total return for the stated period. The “Asset Allocation” portfolio is for illustrative purposes only. Past performance is not indicative of future returns. From the JP Morgan “Guide to the Markets” – U.S. Data are as of April 30, 2025.
As we saw in the above chart from State Street, risk factor performance rotates over time as well, and it is difficult to predict which factor will perform best at any given time.
Though large cap growth has faded this year, it dominated over the past few years, but there may be signs that factor performance has begun to rotate again over the past 3-6 months or so, especially regarding value stocks.
Although we clearly are not there yet on SMID cap stocks, we think that day is coming.
In the end, quality maintains its consistent performance. This is why we believe that when building portfolios diversified at the risk factor level, quality should be the “anchor” or core holding while building satellite factor exposures around it.
We will never apologize for being overweight quality in any portfolio we are asked to build or advise upon.
As always, we welcome your questions and feedback.
[1] DuPont analysis – Wikipedia