Hey, Mr. President
All you congressmen, too
You got me frustrated
And I don’t know what to do
I’m trying to make a living
I can’t save a cent
It takes all of my money
Just to eat and pay my rent
I got the blues
Got those inflation blues
(FROM “INFLATION BLUES” BY B.B. KING, 1983)
By Scott Welch, CIMA®, Chief Investment Officer & Partner
Reviewed by Carter Mecham, CMA®, IACCP®
There are a lot of things going on right now, and the media is focused on all things Trump (and Musk).
But we find it useful to pay attention to the underlying fundamentals. There are many of them, but this blog will focus on three important ones – inflation, the labor market, and interest rates.
Let’s dive in.
Inflation
Let’s begin with a reminder of the Fed’s mandate: optimize inflation and employment within the US economy. The target rate for annualized inflation has historically been (arbitrarily, in our opinion, but it is what it is) 2% annualized. It’s also helpful to remember that, until recently, a 5% unemployment rate was considered a “full employment” economy.
We are publicly on the record saying we did not believe the Fed needed to cut rates last September. We recognized, however, that back in July and August when the Fed “narrative” switched from “inflation” to the “labor market” (which appeared to be cooling at that time), the path was being laid to cut rates in September. We did not expect a 50-basis point cut, but that’s what we got, followed by additional 25 basis point cuts in November and December.
In our opinion, the Fed kept rates too low for too long, which conspired with massive fiscal stimulus plans to drive inflation up toward 9%. We have come down significantly since then but, remember, that a decline in inflation is not the same as deflation.
In other words, even if the Fed is successful in getting inflation down to its target 2% annualized rate, that 2% increase per year is on top of the 9% from a few years ago – those spikes in prices are “baked into” current prices.
This is a big reason the average American consumer is not “feeling” like prices are coming down – because they are not.
So, let’s look at the numbers.
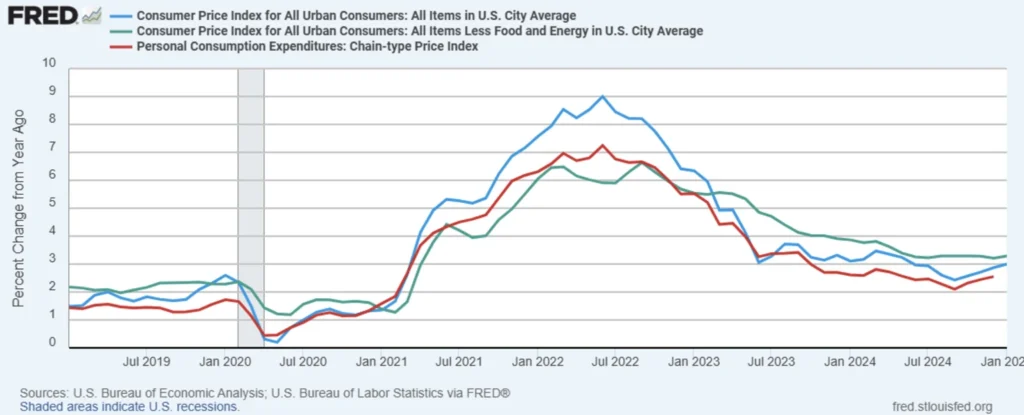
Note the headline “CPI” number (blue line) remains anchored above 2% annualized and, in fact, rose the past two months. CPI ex-Food & Energy (those two items removed because they tend to be more volatile), which is the green line, is even higher because oil prices have fallen recently. We watch this number but, to the average US consumer, it is irrelevant since a large chunk of their monthly budget is paying for food and gas.
Which brings us to Personal Consumption Expenditures (PCE, the red line), which is the Fed’s preferred metric for evaluating inflation. Why? Because it captures “replacement” – that is, the reality that as prices go up, consumers will switch to a cheaper alternative. The classic examples are buying hamburger instead of steak or regular gas instead of premium.
But this metric has ticked up as well and remains stubbornly above the 2% annualized rate. This certainly is one reason the Fed has moved to a more cautious approach regarding rate cuts.
As one last consideration, let’s look at the PCE ex-food, energy, and housing metric, sometimes referred to as the “super core” inflation rate. These three items, plus health care, make up the majority of the average American’s monthly budget. We see the same result – inflation remains “sticky.”
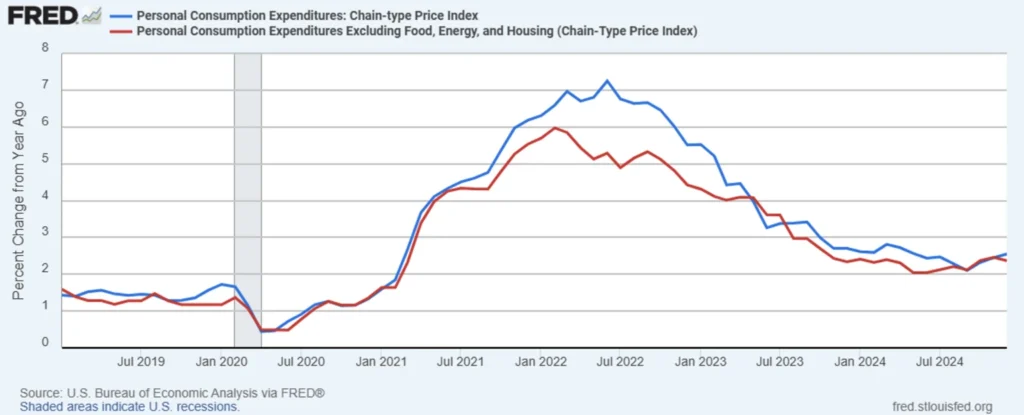
While the housing information comes in with a 6–9-month time lag, and needs to be evaluated accordingly, the bottom line is consistent – inflation is trending in the right direction but remains elusively outside the Fed’s target rate of 2% annualized.
The Labor Market
Next, let’s look at the labor market, starting with the “headline” unemployment numbers.
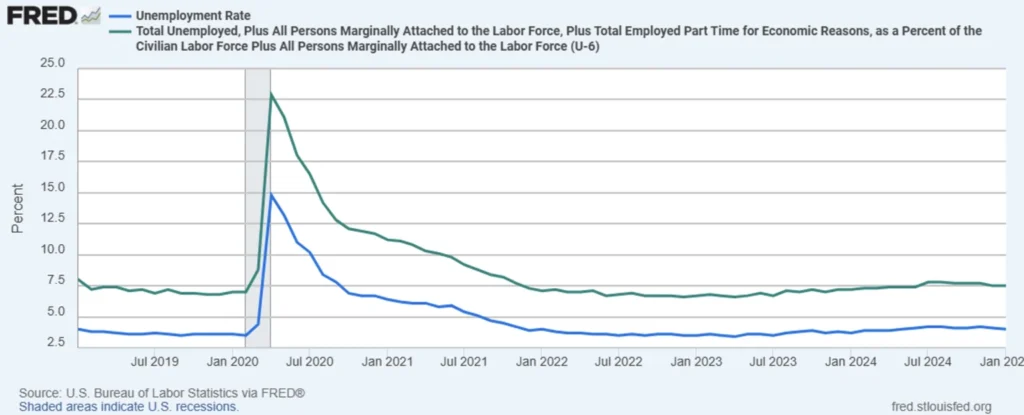
Remember, historically a 5% unemployment rate represented what many economists considered a “full employment” economy. We have been below that level since mid-2021 and remain below that today. It is hard to argue, based on these numbers, that the US labor market is declining.
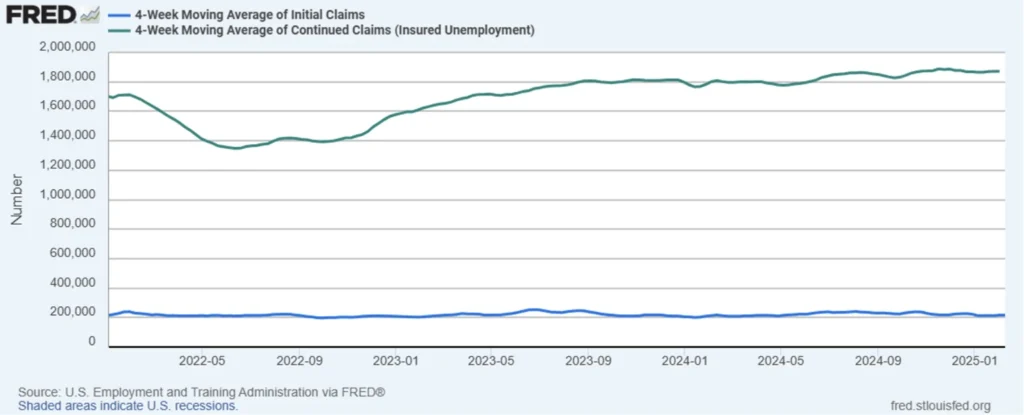
But let’s dig a little deeper. First up is the weekly initial and continuing jobless claims – the number of people who filed for unemployment or are continuing to claim unemployment. These numbers come out weekly and tend to be volatile, so we will look at the 4-week average of both numbers to “smooth out” some of that volatility.
What we see is a resilient labor force with fairly stable unemployment claims at both the initial and continuing level.
Finally, let’s look at some of the “numbers behind the numbers,” specifically the job openings rate, the “hires” rate, and the “quits” rate. These numbers are self-explanatory, but the quits rate deserves a little more attention. While the absolute level of this metric is relevant, the informational value is the trend since the quits rate is a measure of workers’ confidence in finding another position if they leave their current one. This provides valuable information into the “state of mind” of the average worker regarding the labor market and overall economy.
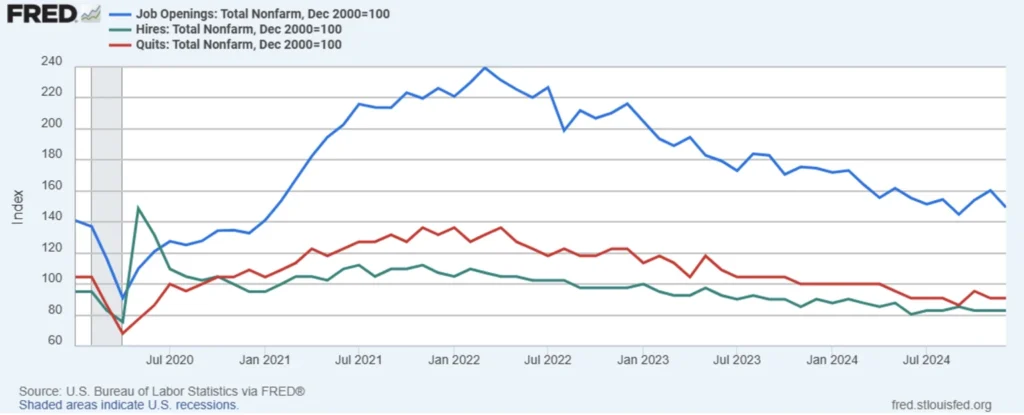
What we see is a general trend downward in all three metrics, with some bumps along the way. This suggests the labor market may be “cooling” but remains resilient.
Yet another reason the Fed is struggling to continue an aggressive rate cut regime.
Interest Rates
Finally, let’s look at interest rates and credit spreads, especially because they are so influenced (at the short end) by Fed policy.
Let’s start with rates.
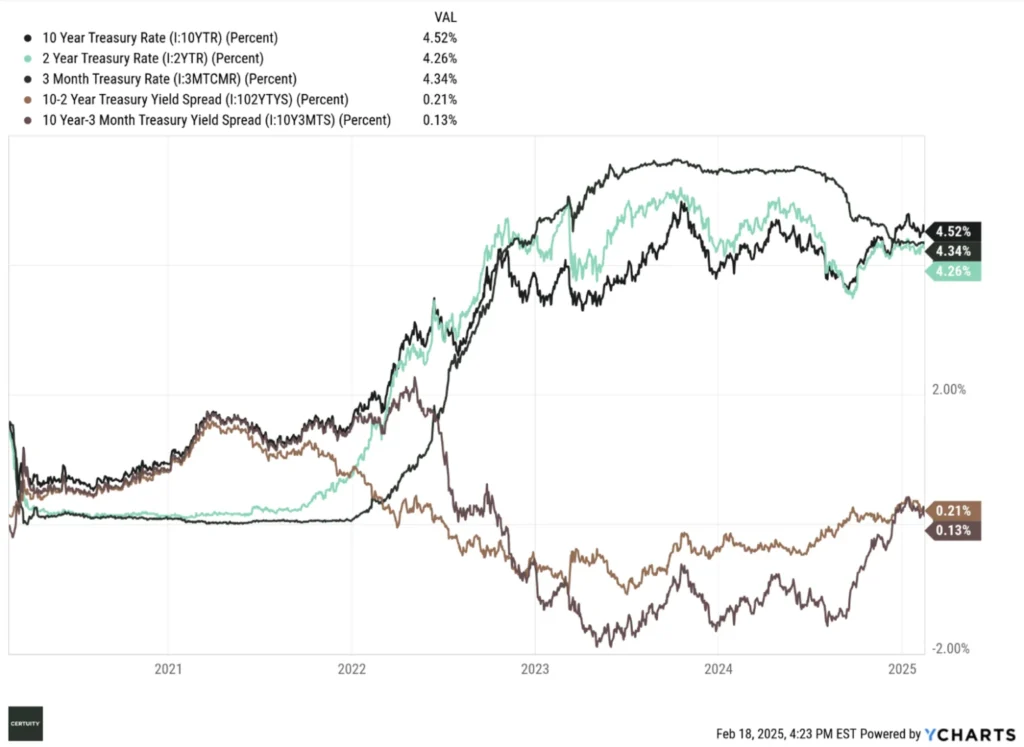
The yield curve “un-inverted” in late 2024 and resumed a “normal” upward sloping shape – a trend we believe will continue. The Fed may eventually cut rates again, but that will mostly affect the short end of the curve. We believe the pressure on the long end of the curve (i.e., the 10-year rate) remains upward, not downward, barring a geopolitical event that generates a “flight to safety” rush into Treasuries. We expect it to be range bound between roughly 4.5-5%. In other words, we expect to see a steepening of the yield curve as we move through 2025.
Now let’s look at credit spreads.
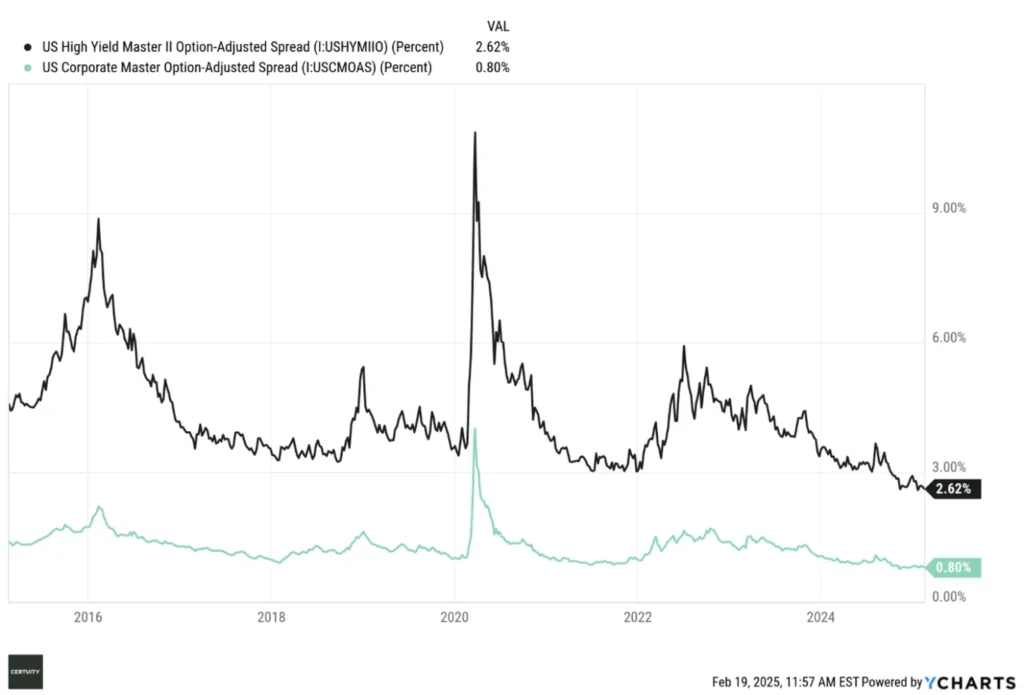
What we see is credit spreads as tight as they have been in ten years. This suggests remarkable complacency by public bond holders. It is true that many companies did a respectable job restructuring their debt back in the “ZIRP” (zero interest rate policy) days, so current debt holders can probably feel confident about their coupons.
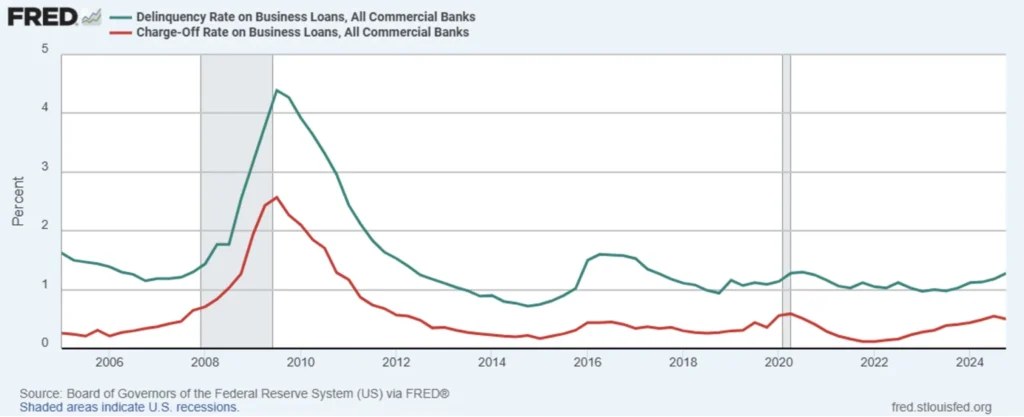
But it is also true that debt delinquencies and default rates are rising. In our opinion, not to problematic levels at this point, but something to keep an eye on.
Summary and Investment Implications
The Fed would like to continue to cut rates, and President Trump is on the record (loudly) that he wants lower rates as well. As a life-long real estate developer that is what he would want, always.
But the Fed is in a bit of a pickle. The economy is growing positively, albeit not robustly. Inflation is “sticky” and perhaps even trending upward. And the labor market, despite (perhaps) some signs of cooling, is proving to be more resilient than many economists expected.
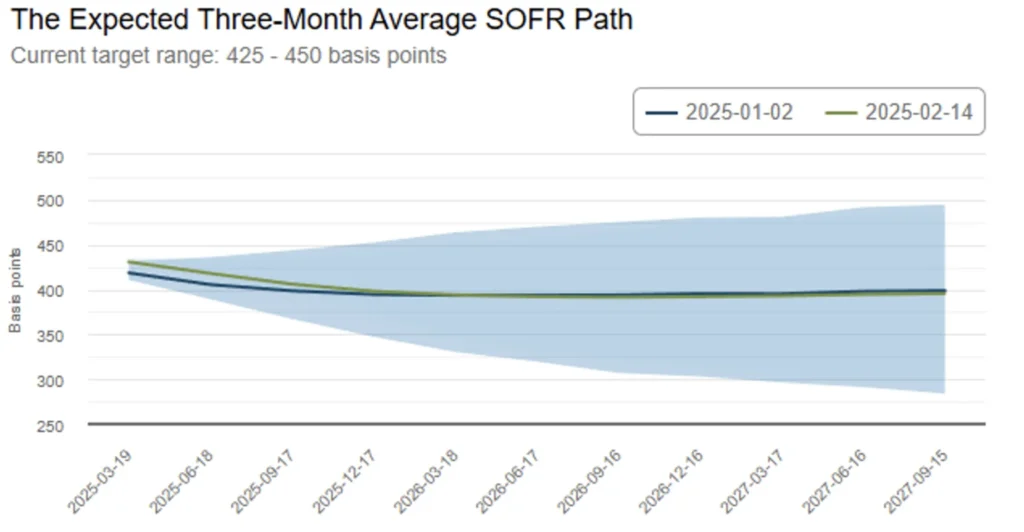
All these factors make it difficult for the Fed to continue an aggressive rate cut regime. If we were having this conversation at the beginning of the year, the market was pricing in an additional 25 basis point cut by the Fed at its March meeting, but that probability has now fallen to almost zero, and any future rate cuts are not expected until June or July.
This is not what the market hoped for, but here we are. The market always prefers lower rates, but our opinion is that, despite many past mistakes, the Fed is taking an appropriately cautious approach, in fear of reigniting inflation.
From an investment perspective, it means a few things (to us):
1. There remains little incentive to lengthen the duration of public fixed income exposure. The yield differential between the 10-year and 3-month Treasury rates remains less than 25 basis points. That may change as we move forward but, for now, investors simply are not being rewarded for taking on interest rate (duration) risk, especially if we are correct in our view that the 10-year rate will remain range bound. We continue to recommend a “barbell” approach – balancing short-term and longer-term allocations to generate sufficient yield without taking on too much interest rate exposure.
2. Given our view on both rates and credit spreads, we are not bullish on the total return potential of the public fixed income market. We believe coupons for current bondholders are reasonably safe, but if investors are interested in generating higher yield on their fixed income allocations, we strongly prefer the private credit markets for those investors who can access it.
We hope you find this useful and, as always, are happy to address any questions or follow up.