Market Volatility: What’s Driving it and What’s Next
And don’t speak too soon for the wheel’s still in spin
And there’s no tellin’ who that it’s namin’
For the loser now will be later to win
‘Cause the times, they are a-changin’
(FROM “THE TIMES ARE A-CHANGIN'” BY BOB DYLAN, 1964)
By Scott Welch, CIMA®, Chief Investment Officer & Partner
Reviewed by Carter Mecham, CMA®, IACCP®
Regular readers of our blogs know we have been saying for several months that the US stock market was “priced for perfection” and due for a dip, especially the mega-cap tech stocks. We may well be working our way through that moment right now.
In this blog we try to make sense of what is happening and where we might go from here. This may feel a little longer than most of our blogs, but that is simply because we will be using more charts and graphs. Let’s dive in.
Historic Market Rally
First, a little history. From the end of the Great Financial Crisis (GFC) in 2009 (and the beginning of the zero-interest rate regime) until roughly the end of 2024 (with hiccups along the way in 2020 and 2022), equity markets enjoyed an almost unprecedented global rally – especially here in the US.
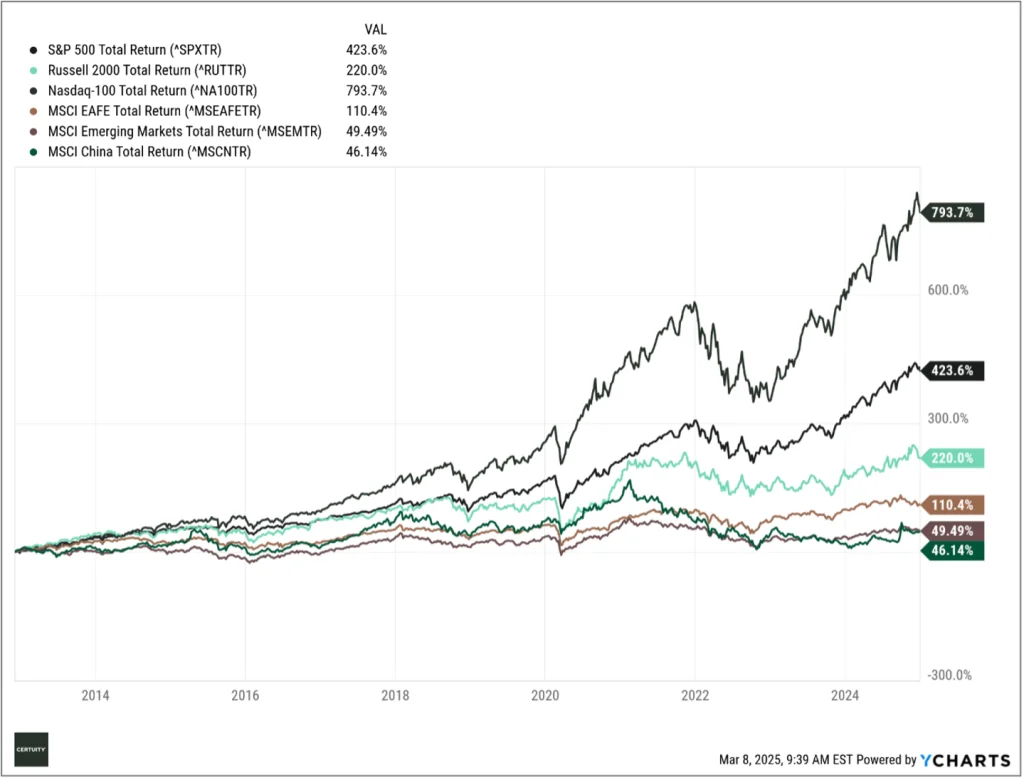
Source: Ycharts, data from January 1, 2013 through December 31, 2024. You cannot invest in an index and past performance is no guarantee of future results.
Excess liquidity, generally positive economic conditions (except during the Covid years), and the boom in Artificial Intelligence were primary catalysts to this rally, especially for the “mega-cap tech” stocks that were first movers into AI.
You can see that reflected in the skyrocketing performances of the NASDAQ-100 and S&P 500 indexes in the chart above. Also notable in the chart is the positive but lagging performance of the Developed International (EAFE) and Emerging (EM) Markets.
Current Market Volatility
But the times they may be a-changin.’ Since mid-February, the VIX has been quickly climbing to 30, indicating growing investor stress and market volatility.
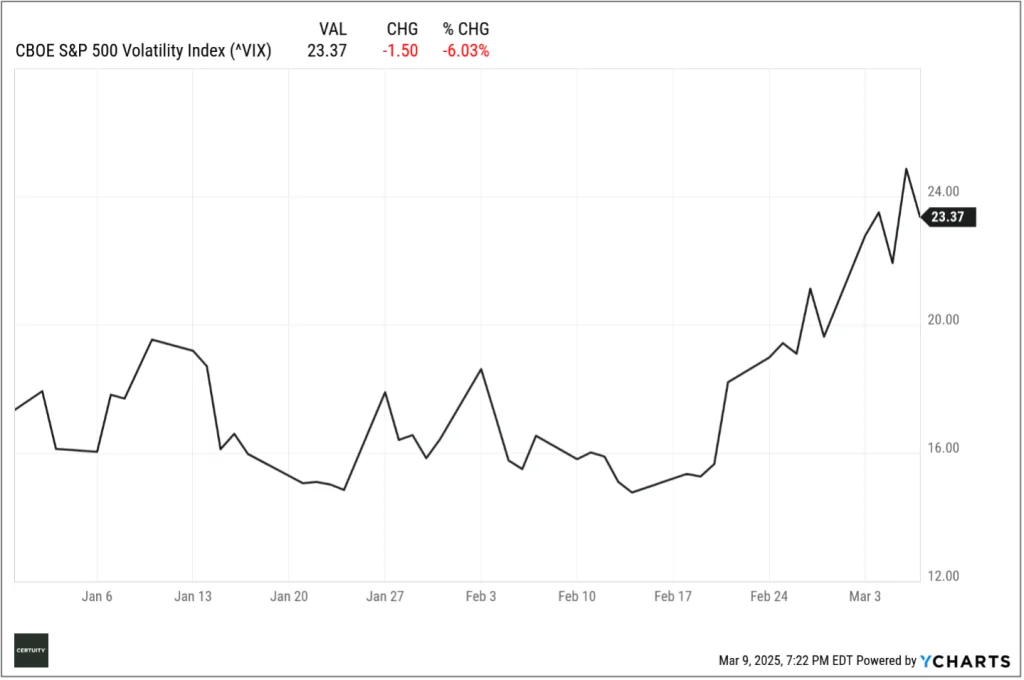
Source: Ycharts, YTD through March 7, 2025. You cannot invest in an index and past performance is no guarantee of future results.
Take a look at YTD performances so far in 2025 as well.
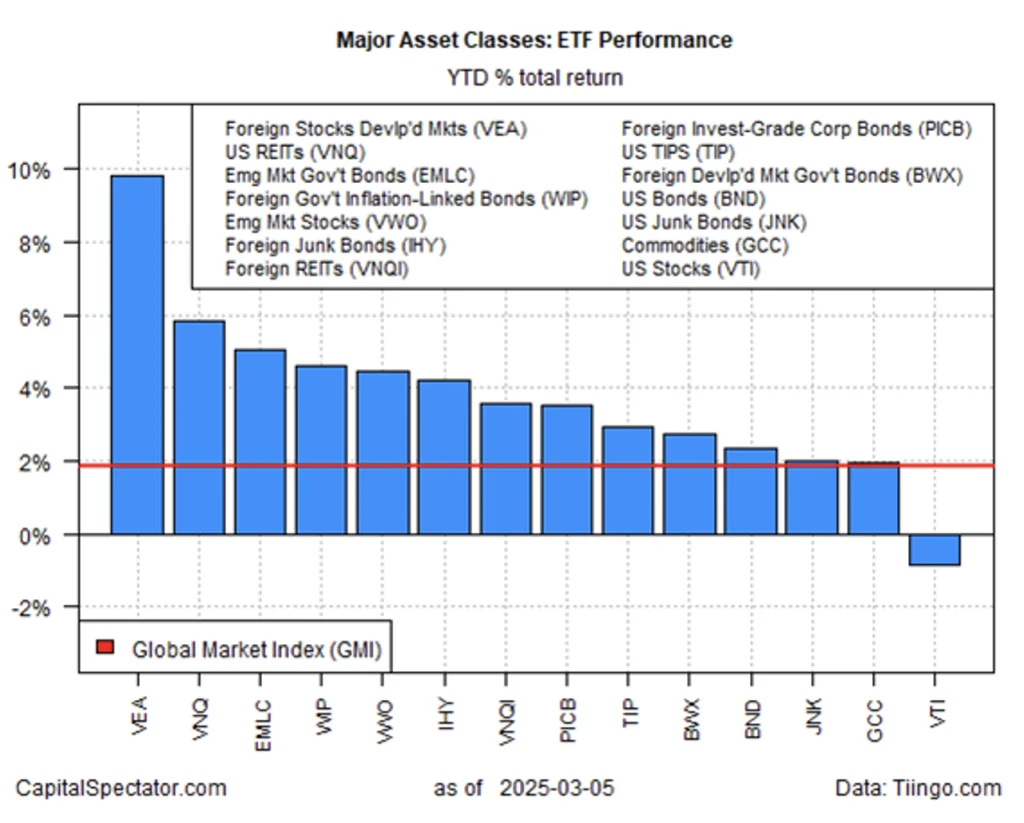
Source: Capital Spectator, as of March 5, 2025. ETFs listed are for illustration and comparison purposes only, and do not represent specific investment or product recommendations, or investment advice. Past performance is no guarantee of future results.
The primary driver of US underperformance has been the fall-off of those mega-cap tech stocks (as they represent 35-40% of the entire index market cap). As we’ve written, these are fine companies that were carrying remarkably high valuations, and that it would not take much to take some air out of their tires. We further suggested that any decline in these stocks would have an amplified effect on the index performance. Well, here we are.
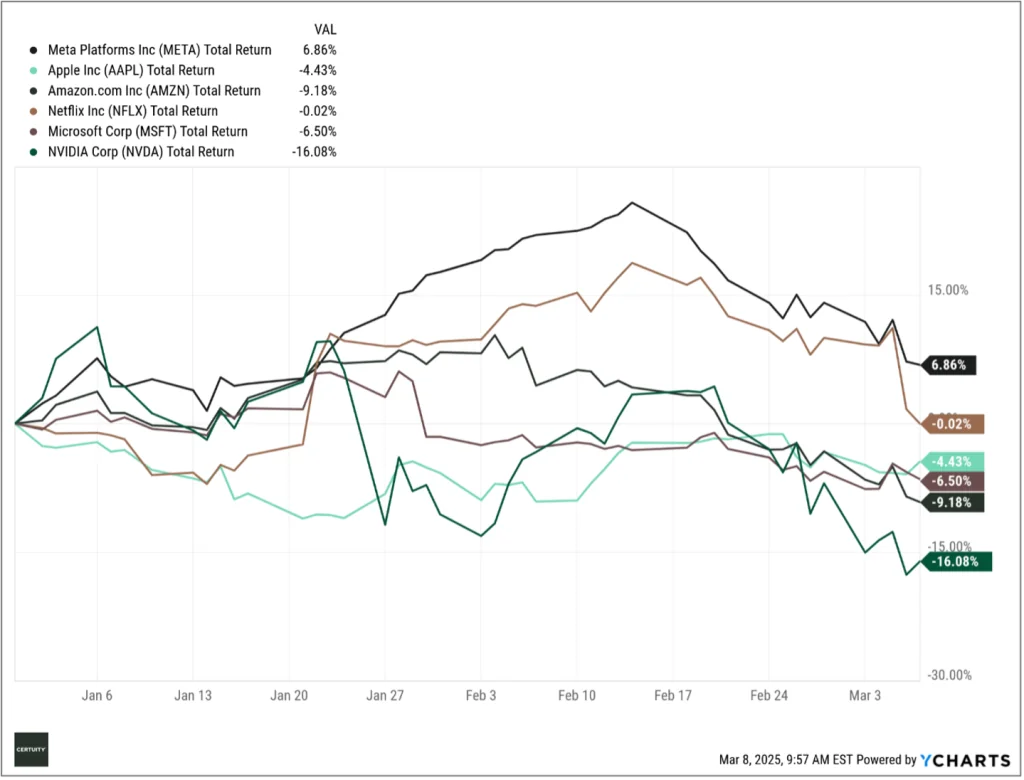
Source: Ycharts, YTD performance through March 7, 2025. Past performance is no guarantee of future results.
Within the US, we believe there are several catalysts for this recent decline:
- Frothy valuations, as discussed above
- Uncertainty over the future direction of the US economy, which seems to be cooling
- Uncertainty over future Fed policy – will it cut rates again and, if so, when? This group of stocks are interest-rate sensitive and tend to perform better in a lower rate environment.
- Uncertainty over the direction and effectiveness of Trump’s stated regulatory, tax, and tariff policies. In his first two months President Trump has been somewhat chaotic in his tariff approach, often changing his mind very quickly.
This creates uncertainty for market players, and uncertainty is what investors dislike most. You can see this clearly if we just focus on the YTD performances of the three primary US indexes.
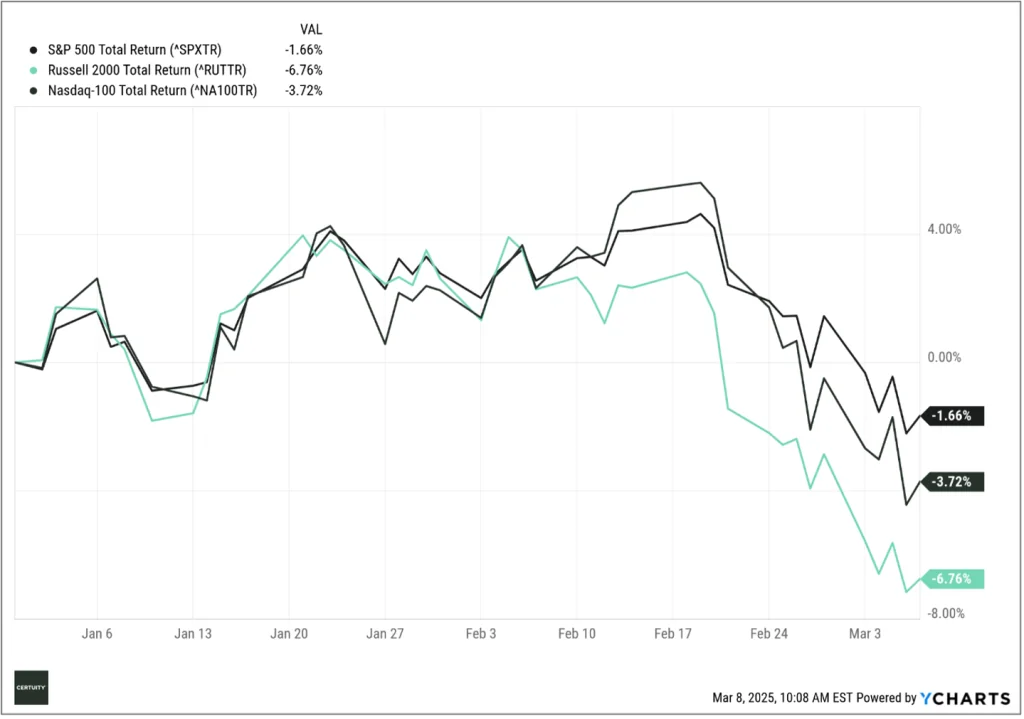
Source: Ycharts, YTD performance through March 7, 2025. Past performance is no guarantee of future results.
There may be another force at play as well – the resurgence of the Chinese tech market as the Chinese government seeks to re-catalyze this market to better compete with the US – after years of repressing this same market for political purposes.
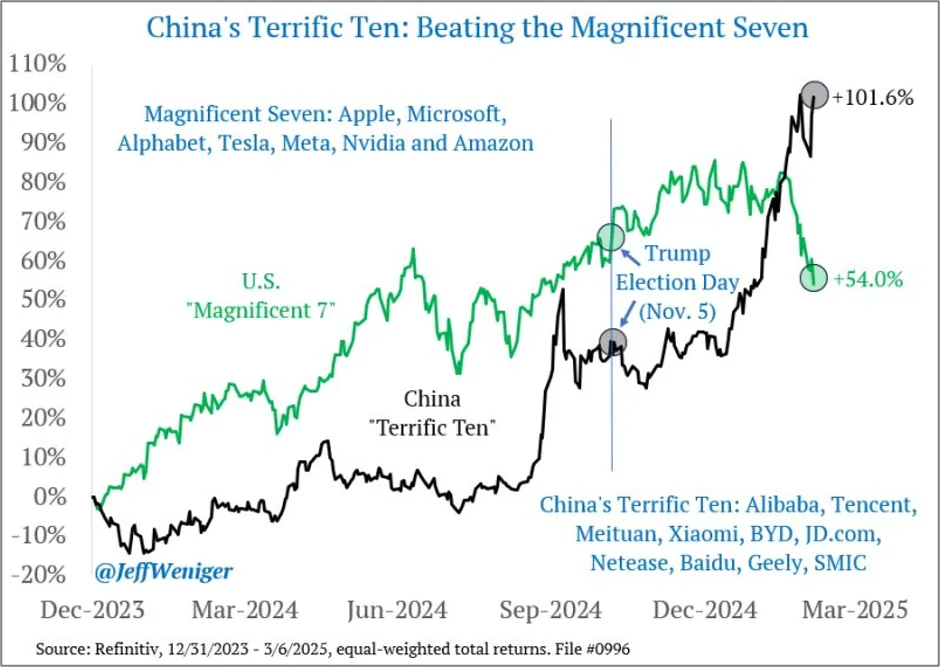
Source: WisdomTree and Jeff Weniger, data from December 31, 2023 through March 6, 2025. Past performance is no guarantee of future results.
And it’s not just asset classes that may be rotating. Regular readers know we believe not just in asset class diversification but also risk factor diversification. Rotation seems to be a primary theme this year.

Source: Capital Spectator, as of March 6, 2025. ETFs listed are for illustration and comparison purposes only, and do not represent specific investment or product recommendations, or investment advice. Past performance is no guarantee of future results.
While we are not seeing any rotation between large and small cap stocks (yet), it is interesting to see that dividends, value, and quality currently occupy three of the top four performing YTD large cap factors, after years in the doldrums.
One last performance comparison we will make is the performance of large, mid, and small cap stocks within the US, as well as a comparison of large growth stocks to large cap value stocks.
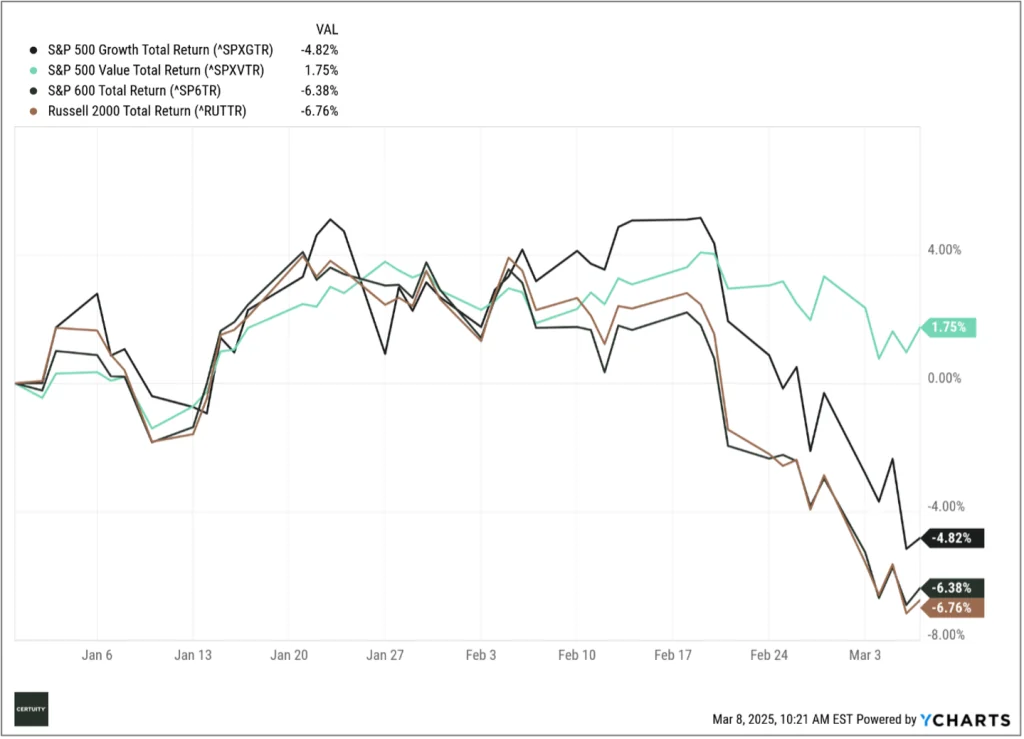
Source: Ycharts, YTD performance through March 7, 2025. You cannot invest in an index and past performance is no guarantee of future results.
Despite the nosedive large cap growth stocks have taken this year, small cap stocks have fallen further. Why? For several of the reasons the mega-cap tech stocks have – uncertainty over the economy, interest rates, and tariffs. We will revisit this when we examine the comparative valuations of these different asset classes.
Market Outlook
So, what might we expect from here?
In looking forward as we move through 2025, we will focus on two primary things – earnings and valuations. We recognize that other things can affect market performance (economic conditions, policy changes, geopolitical issues, etc.) but we will focus on the two most important company-specific ones.
Earnings
Let’s begin with earnings. The Q4 2024 earnings season is not quite over, but the results so far and the expected ones that are still outstanding are positive. As we move through 2025, revenues and earnings are expected to remain quite positive, though perhaps not as robust as Q4.

Source: Zachs Earnings Report for the S&P 500, as of March 5, 2025. The green lines are earnings, and the orange lines are revenues. Solid bars represent actual results. The hatched bars are estimates, and therefore subject to change.
Note the growth expected in 2025 despite expected flat revenues. One way to potentially interpret this is that the market is pricing in significant productivity gains as AI gains traction.
The technology sector itself is expected to see a dramatic cooling of its revenues and earnings.
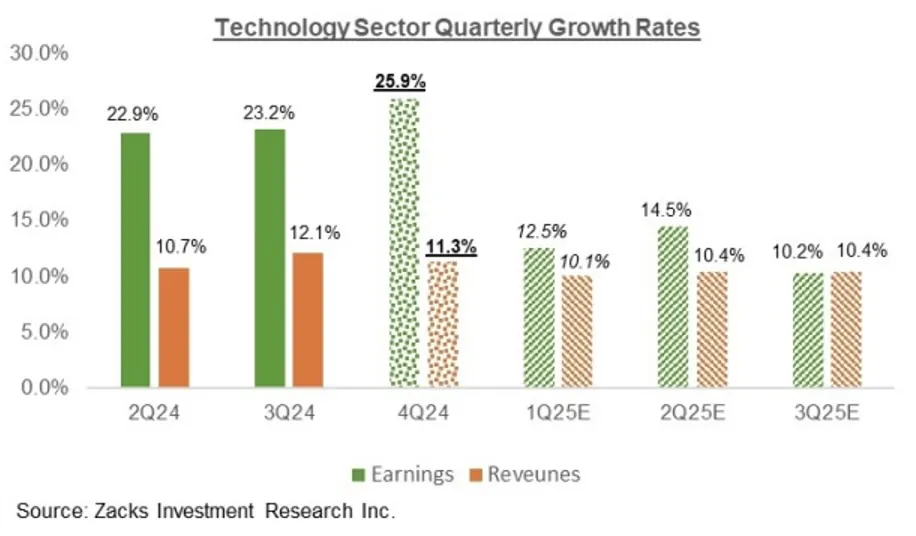
Source: Zachs Earnings Report, as of March 5, 2025. The green lines are earnings, and the orange lines are revenues. Solid bars represent actual results. The hatched bars are estimates, and therefore subject to change.
We see significantly different revenue and earnings expectations between large, mid, and small cap US stocks, especially in small caps.
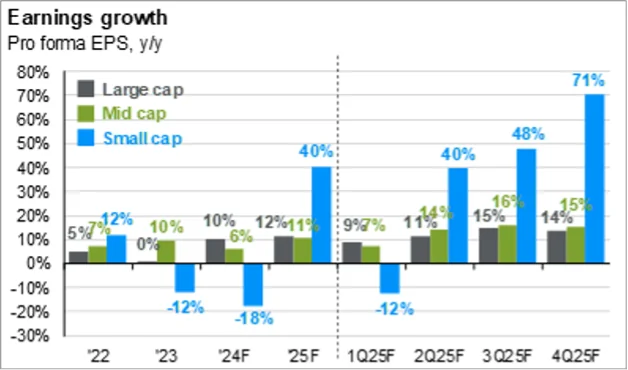
Source: Compustat, FactSet, FTSE Russell, NBER, J.P. Morgan Asset Management. The S&P 500 is used for large caps. The Russell Mid Cap is used for mid cap. The Russell 2000 is used for small caps. Data for the percent of unprofitable companies in each index are from the following quarters: Tech bubble = 4Q01, Financial crisis = 4Q08, COVID-19 = 1Q20 and Current = 4Q24. JP Morgan Guide to the Markets – U.S. Data are as of March 6, 2025. 2022 and 2023 are actual numbers, all others are forecasts and subject to change.
Outside the US, earnings are also expected to be positive this year, though not as strong as in the US.

Source: JP Morgan Guide to the Markets, as of March 5, 2025. Data sources: FactSet, MSCI, Standard & Poor’s, J.P. Morgan Asset Management. Next 12 months consensus estimates are based on pro-forma earnings and are in U.S. dollars. These are forecasts and subject to change.
Valuations
Next, let’s look at valuations. We begin with a look at market valuations in the US, carving out the mega-cap tech stocks. We can see how these stocks have dragged up the overall valuation of large cap stocks, but we can also see the decline in mega-cap stock valuations during the recent downturn.
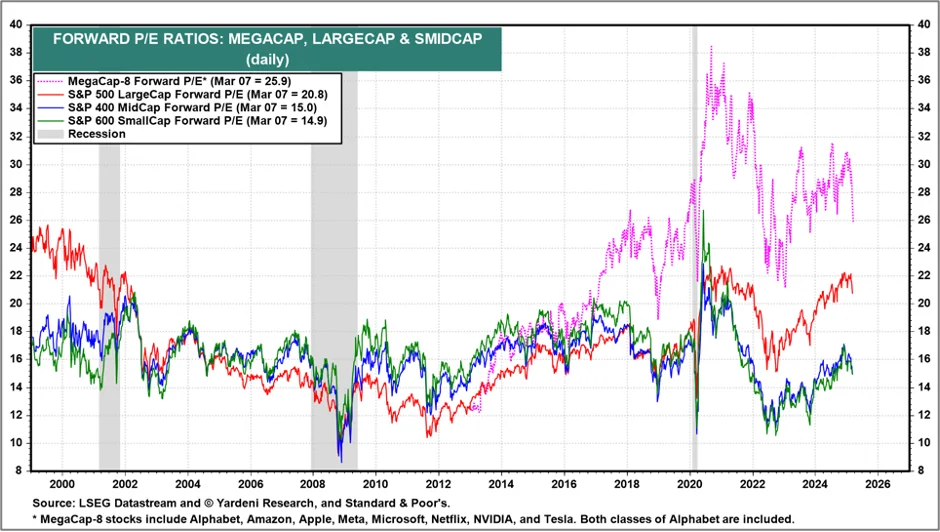
Source: Yardeni Research, as of March 7, 2025.
Here we look at the valuation differentials for large cap growth vs. large cap value stocks. The gap remains wide but has begun to narrow.
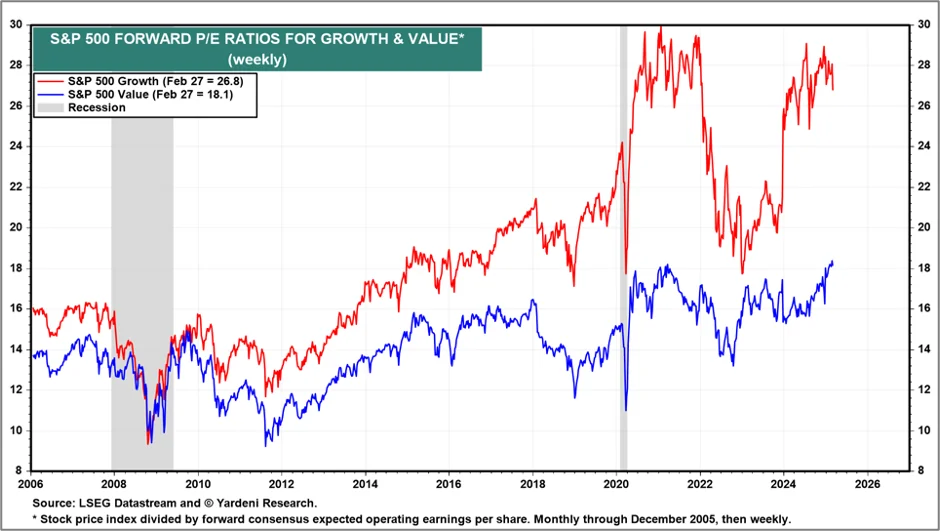
Source: Yardeni Research, as of March 7, 2025, data through February 27, 2025.
In the US, we see valuations are still elevated but returning to earth. Outside the US, most major markets are trading well within their historical averages (with International small caps trading at the most attractive relative valuation).
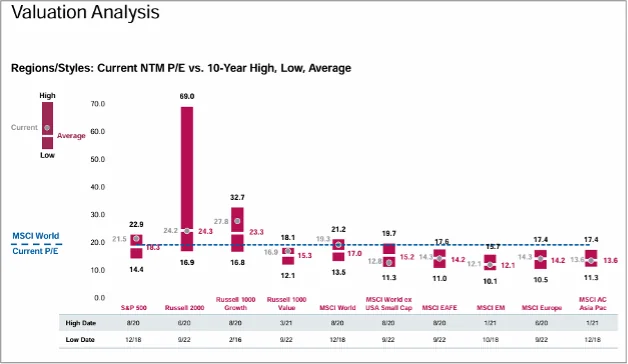
Source: The Eaton Vance “Beat Report” for March 2025. Data source: FactSet as of 2/28/25. NTM P/E is market price per share divided by expected earnings per share over the next twelve months. Data provided is for informational use only. These are forecasts and estimates and therefore subject change.
Summary
Here’s a summary of our thoughts on the investment implications:
- The US and global economy remain positive but show signs of slowing.
- Uncertainty over tariffs, regulations, taxes, and geo-political events have resulted in a spike in volatility – something overly complacent investors have not seen in a while.
- While the mega-cap tech stocks continue to dominate market performance, we may be witnessing a market rotation into more diversified asset classes and risk factors – specifically large cap value, dividends, and non-US markets.
- Earnings in the US are expected to be solid in 2025, though revenues are projected to be stable – perhaps pricing in expected productivity gains from AI.
- As believers in global diversification, we believe investors should be considering reallocating some of their gains in large cap growth stocks into a more diversified mix of asset classes and risk factors – including US small caps, even though this hasn’t shown up in the numbers yet. But the valuation dispersions are as wide as they’ve ever been, and history suggests that markets almost always mean revert.
- More risk tolerant investors might consider international small cap stocks, which currently are trading at the best relative value compared to other markets.
We hope you find this useful and, as always, feel free to reach out to me directly with any questions or follow up.
