“Every picture tells a story, don’t it?”
(ROD STEWART, 1971)
“I just dropped in to see what condition my condition was in”
(KENNY ROGERS & THE FIRST EDITION, 1997)
By Scott Welch, CIMA®, Chief Investment Officer & Partner
Reviewed by Carter Mecham, CMA®, IACCP®
The old weather adage is “March comes in like a lion and goes out like a lamb.”
That certainly did not apply to the global capital markets in March 2025 and, therefore, for Q1 overall. We saw upheaval and market disruptions we have not seen since Covid, caused primarily by President Trump’s tariff policy announcements on April 2nd but telegraphed throughout Q1.
It is too soon to know the longer-term effects of these tariff policies, though the short-term effects have been disruptive. Likewise, Trumps’ desired tax and regulatory reform will impact the markets as well, but those will take longer to play out because they require legislative approval from a Congress only narrowly controlled by the GOP. We seem to have embarked on a new market regime, following several years of complacency and robust global markets.
In some respects, at least by historical standards, we have returned to a more normal market regime, with increased volatility and a renewed focus on fundamentals versus a market driven primarily by sentiment and momentum, where stock prices rose due to expanding multiples (investors willing to pay more for a dollar of earnings) instead of attractive overall valuations and earnings.
When reviewing the current state of the global economy and investment markets, we recommend focusing on market signals and weeding out market noise. We believe the five primary economic and market signals that provide perspective on where we go from here are GDP growth, inflation, central bank policy, earnings, and interest rates.
This is not to dismiss national, political, or geopolitical issues. But these are “known unknowns.” We are aware of them (such as Trump’s tariff announcements) but have no way to forecast how they will turn out or what effects they will have (or not) on the economy and investment markets.
As we write this, these “known unknowns” include (1) the longer-term effects of Trump’s tax, regulatory, and – especially – tariff policies; (2) the ongoing wars in Ukraine and Israel; (3) increasing tensions between the US and Iran (and its proxies in the Middle East); and (4) simmering tensions on multiple fronts between the US, China, and Russia.
Spoiler alert: We believe the risk of recession is increasing, but we are not there just yet. The Fed is in a bit of a pickle: the economy is slowing, and Trump is “jawboning” loudly for lower rates, but the two primary Fed mandates – optimizing inflation and employment – do not (yet) justify an aggressive rate cut regime.
As we write this, the Q4 2024 earnings season has ended and was generally positive. Expectations are for a decline in Q1 revenues and earnings, but then a re-acceleration as we move through the rest of 2025 (though that outlook will change depending on how the tariff and other policy issues play out).
As we anticipated, public market credit spreads have begun to widen, especially in high yield, but from a total return perspective that has been more than offset (for now) by a decline in Treasury yields as the result of a “risk off” flight to quality rotation by investors. Despite this, we remain cautious on the total return potential in the public bond markets over the course of 2025. We prefer private credit for investors seeking to enhance yield.
Speaking of private markets, we continue to see high investor demand for private equity, credit, infrastructure, (mostly energy-relayed) and (after a long drought) real estate. We also see heightened interest in secondaries and the niche market of sports investing. Investors are interested in both traditional drawdown structures (LPs) and in more liquid “Evergreen” solutions – especially in private credit.
GDP, Inflation, and Central Bank Policy
Let’s start with the yield curve (i.e., interest rates), specifically two closely watched “spreads”: the 10-year / 2-year spread (10s/2s) and the 10-year / 3-month spread (10Y/3M) spread.
The yield curve, as measured by the 10s/2s remains positive and upward sloping – that is, “normal”. The recent flight to quality briefly drove down the 10-year rate to below 4% (it has since returned to above 4%), but we do not expect it to remain that low for an extended period of time unless the tariff-driven “trade wars” accelerate.
The 10Y/3M spread, however, has once again inverted – historically, a harbinger of an eventual recession.
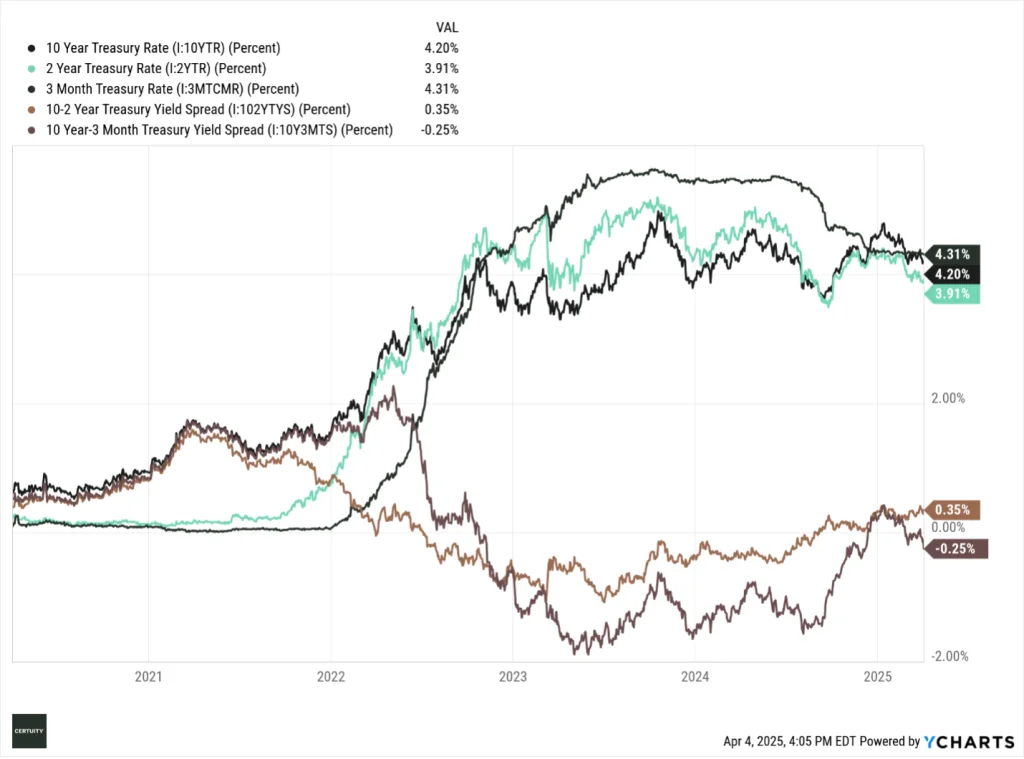
Source: Ycharts, 5-year data through April 3, 2024. You cannot invest in an index and past performance is no guarantee of future results.
As expected, the Fed chose not to cut rates at its March meeting, but it verbally laid the groundwork for a June cut of 25-bps. Following the April tariff pronouncements, the market dramatically changed its views and is now pricing in four rate cuts by the end of 2025. Prior to the tariff “kerfuffle” there were analysts who believed there would be no rate cuts after June.
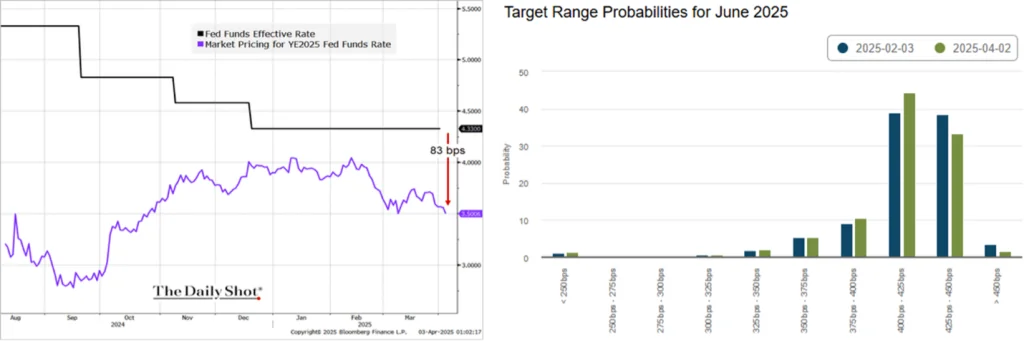
Source: The Daily Shot (left) and the Atlanta Fed “Market Probability Tracker” (right), as of April 3, 2025. These are forecasts and therefore subject to change.
The challenge facing the Fed is that neither inflation nor the labor market are (yet) signaling the need for any dramatic reductions in rates.
Unemployment remains below 5% – historically, the level many economists considered “full employment” for the US economy.
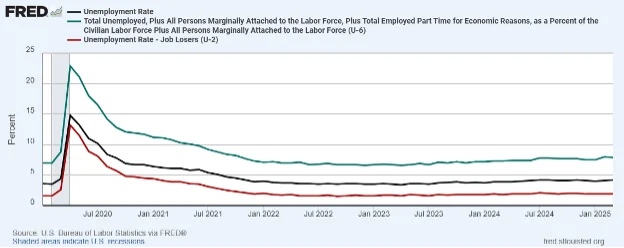
Source: St. Louis Fed (FRED), data through February 2025.
We see a slight trend upward in “continuing” jobless claims, but “initial” claims (workers filing for unemployment benefits for the first time) have proven to be remarkably resilient since Covid ended. We use the 4-week moving averages of these numbers to smooth out the weekly volatility.
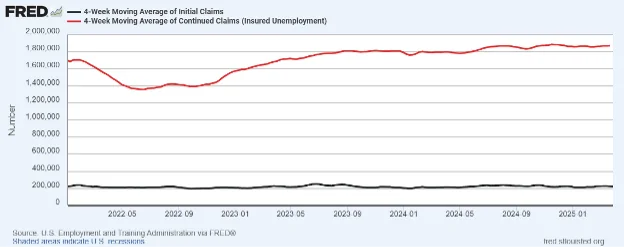
Source: St. Louis Fed (FRED), data through March 2025.
There are signs, however, of a “cooling” in the labor markets. Job openings, hires, and quits are all trending downward. The quits rate is interesting because it is an indication of how confident employees are that they can find better work elsewhere if they leave their current positions (so a downward trend means less confidence).
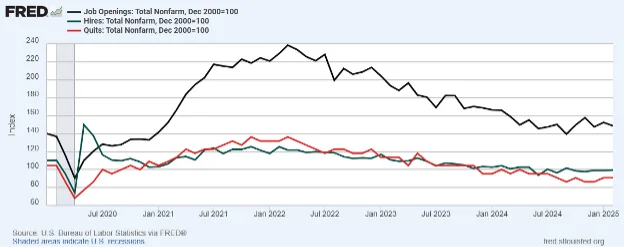
Source: St. Louis Fed (FRED), data through February 2025.
Inflation was trending in the right direction (though it remains above the Fed’s annualized target rate of 2%) but market-priced inflation spiked following the tariff announcements. Until we have greater clarity, this will make it difficult for the Fed to be overly aggressive in cutting rates.
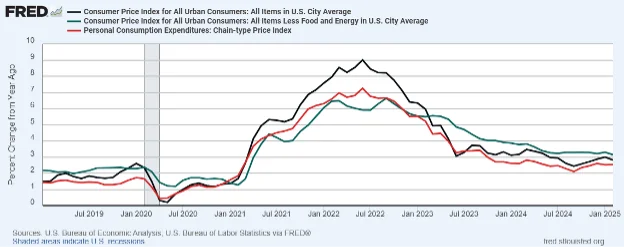
Source: St. Louis Fed (FRED), data through February 2025.
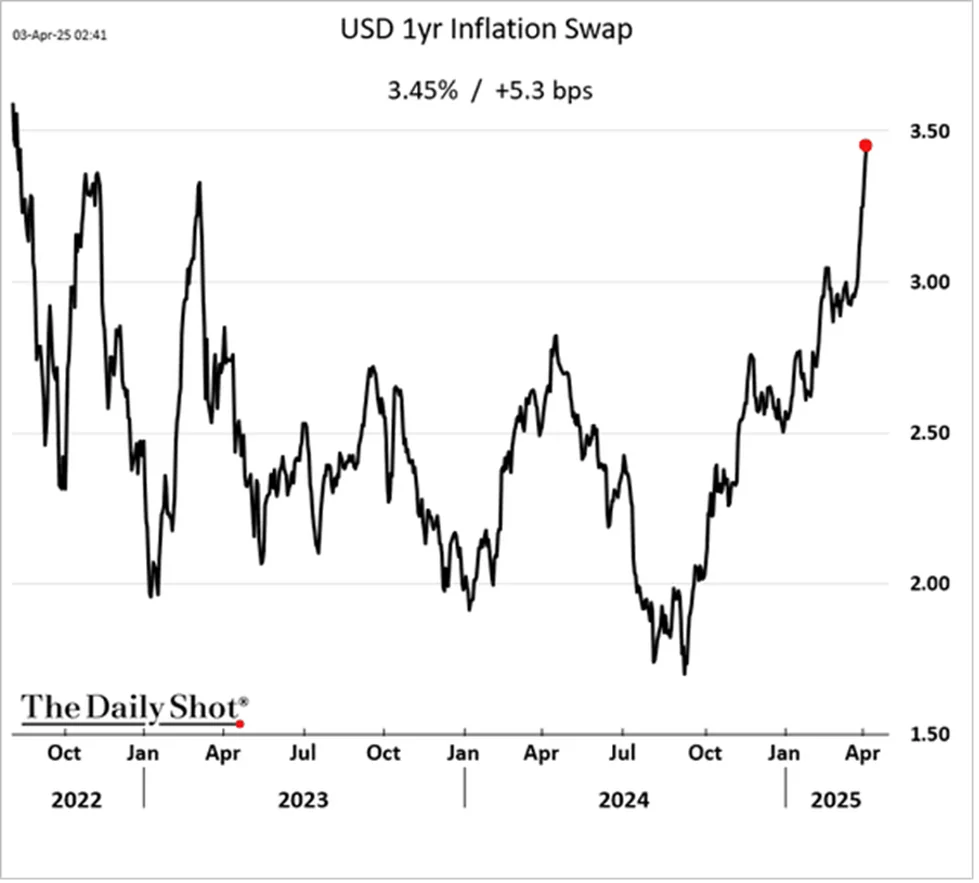
Source: The Daily Shot, as of April 3, 2025. This is a forecast and subject to change.
The current Atlanta Fed “GDPNow” forecast suggests a Q1 economic growth rate of negative 2.8% – a dramatic decline over the past 2-3 months. Remember, the “technical” definition of recession is two consecutive quarters of negative GDP growth.
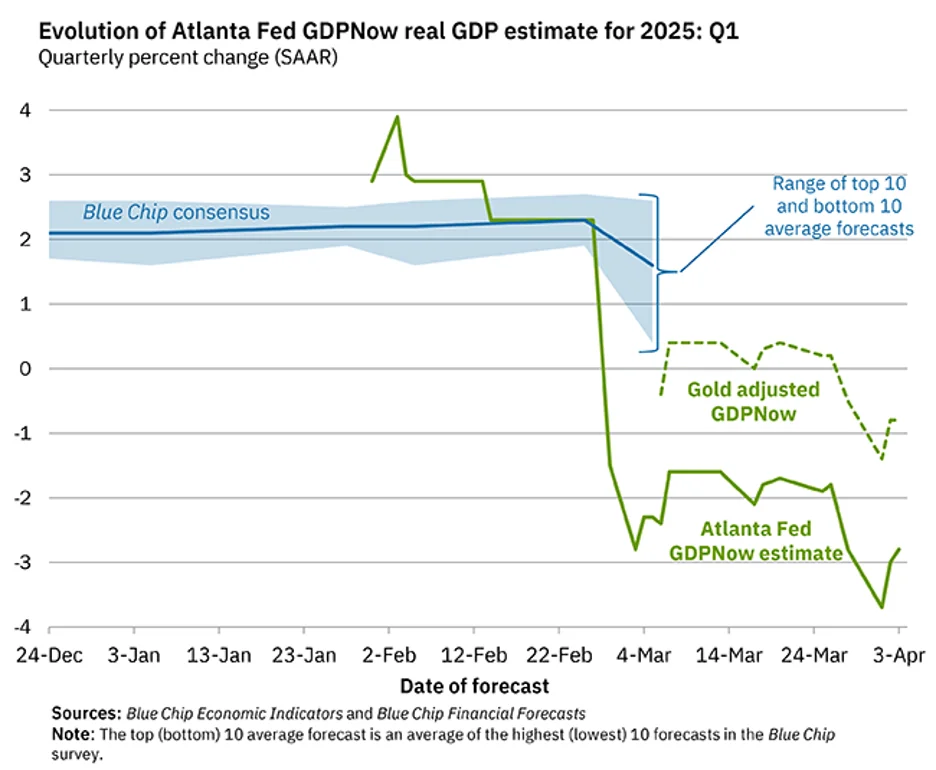
Source: the Atlanta Fed “GDPNow” Forecast, as of April 3, 2025. This is a forecast and subject to change as additional data come in.
Longer term, the Fed is still forecasting modest growth over the course of 2025 and into 2026. Remember, however, that (1) this forecast came out in mid-March, and thus before the April 2nd tariff pronouncements, and (2) the Fed is notoriously bad at accurately forecasting future GDP growth rates.

Source: The FOMC “Summary of Economic Projections,” as of March 19, 2025. There is no guarantee that any projection, forecast, or opinion will be realized. Actual results may vary.
Estimates for economic growth outside the U.S. are muted but positive, and roughly in line with historical averages.
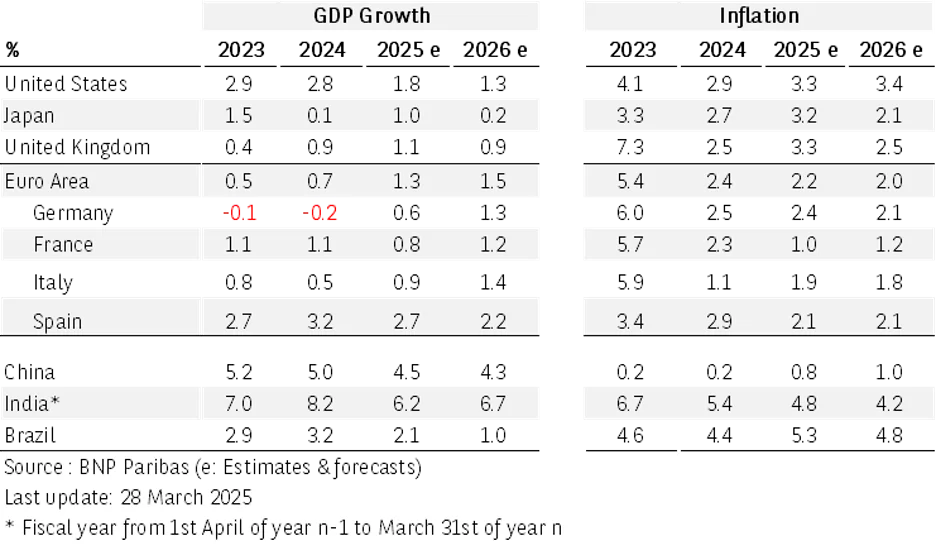
Source: BNP Paribas, as of March 28, 2025. There is no guarantee that any projection, forecast, or opinion will be realized. Actual results may vary.
Earnings and Valuations
The Q4 2024 earnings season ended recently. Revenues and earnings were solid, and the consensus estimates are for a decline in earnings in Q1 2025 followed by a reacceleration of earnings as we move through the remainder of 2025.
As with other market metrics, these forecasts were made prior to the April 2nd tariff pronouncements, so they may change dramatically going forward, depending on the longer-term outcome of what looks increasingly like an impending global trade war.
Note that earnings are expected to increase through 2025 despite relatively flat revenue projections as the market seems to be pricing in significant productivity gains, perhaps due to accelerating applications of artificial intelligence (AI).
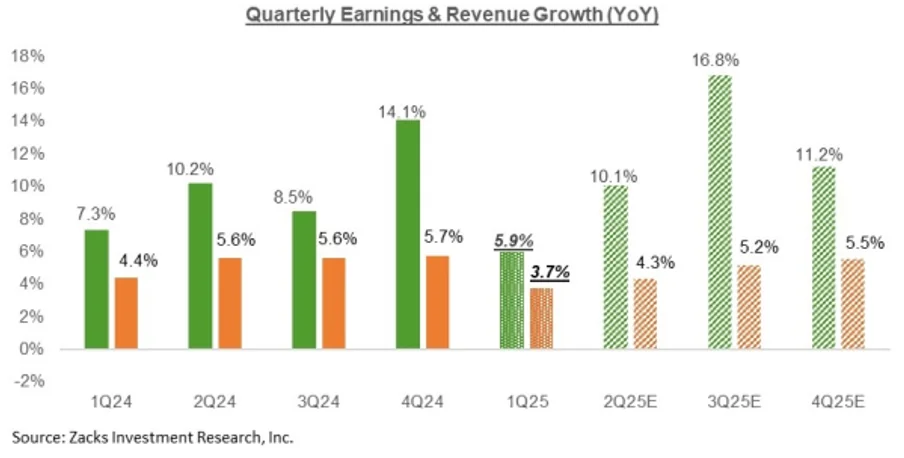
Source: Zacks Investment Research, as of April 2, 2025. Green bars are earnings and orange bars are revenues. Solid bars are actual results, while hatched bars are estimates and, therefore, subject to change.
Outside the US, earnings growth estimates are muted but positive. Even China is expected to show earnings growth as the result of significant monetary and fiscal stimulus from the Chinese government.
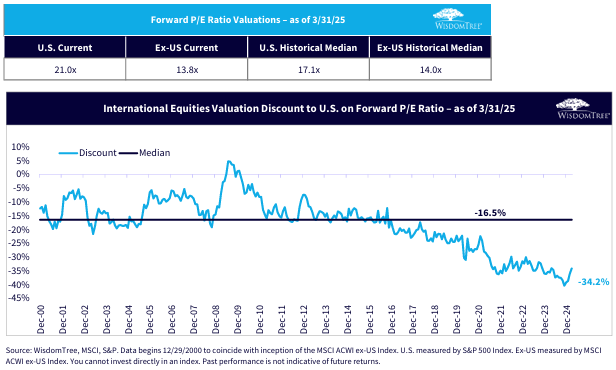
Despite the sell-off in US stocks, global valuations are more attractive outside the US (though the S&P 500 index valuation remains skewed upward by the mega-cap tech stocks). However, the global equity rally over most of the past 12-18 months has resulted in few, if any, “screaming buys” across the equity spectrum.
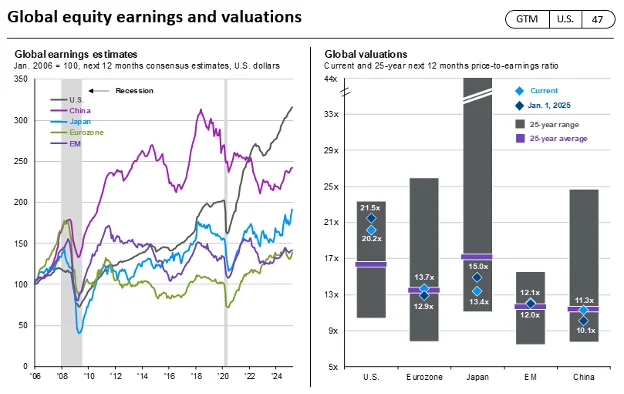
Source: FactSet, MSCI, Standard & Poor’s, J.P. Morgan Asset Management. Next 12 months consensus estimates are based on pro-forma earnings and are in U.S. dollars. Past performance is not a reliable indicator of current and future results. (Right) The purple lines for EM and China show 20-year averages due to a lack of available data. Guide to the Markets – U.S. Data are as of March 31, 2025.
Within the US, and despite the recent rout in the mega-cap tech stocks, there remains a significant valuation dispersion between these stocks and broader large cap, mid cap, and small cap stocks. We see a similar dispersion between large cap growth and value stocks. And the valuation difference between US and non-US stocks remains as wide as it has been in more than 20 years.
It appears too early to recommend rotating back into SMID cap US stocks. There is too much uncertainty regarding future economic activity and interest rates.
But patient and fundamentally driven investors may want to consider re-allocating back into US large cap value and developed international stocks as they position their portfolios for longer-term time horizons.
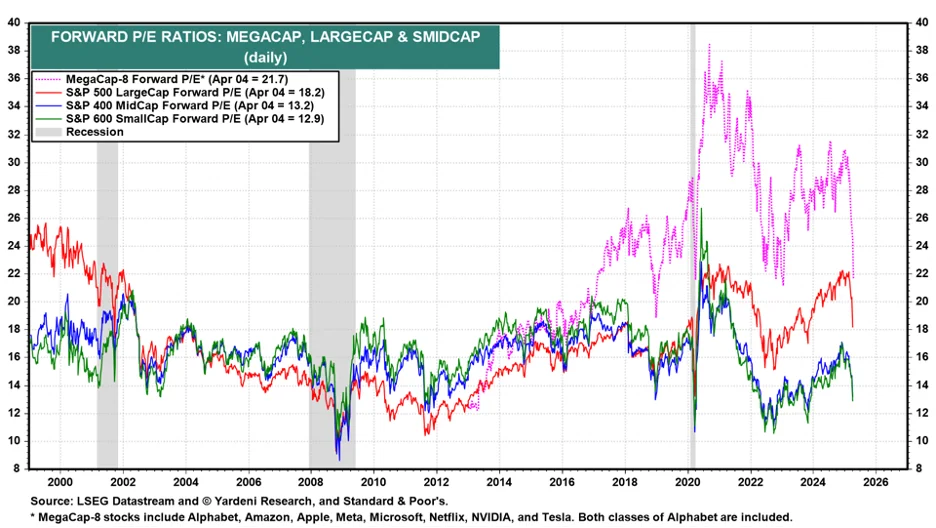
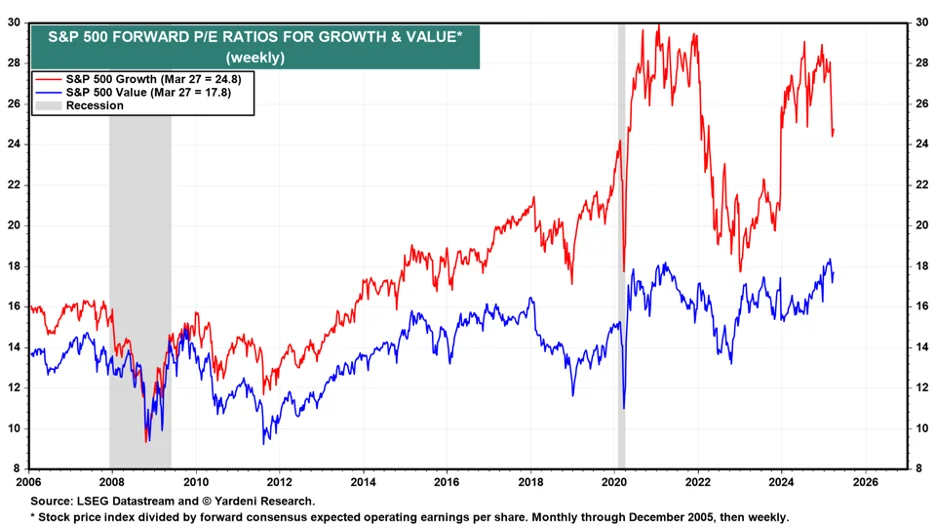
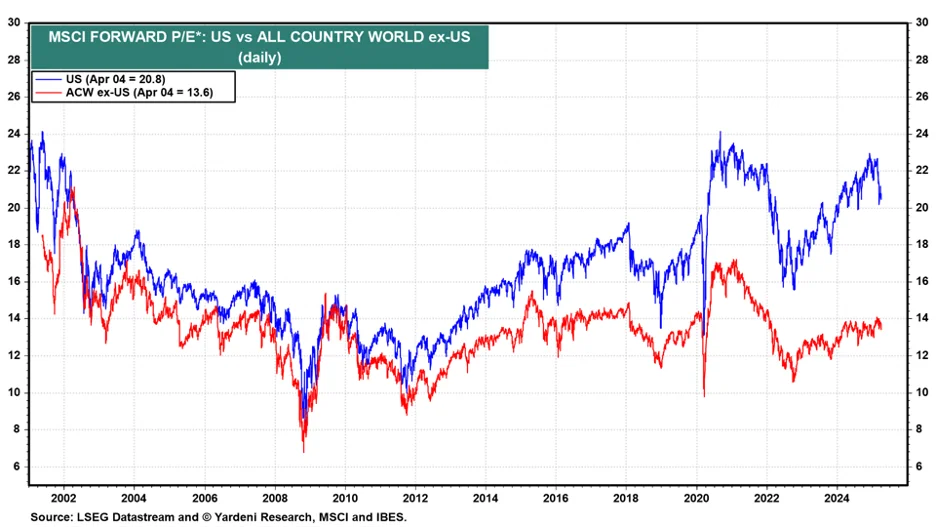
Source for all three previous charts: Yardeni Research, through March 2025. You cannot invest in an index and past performance is no guarantee of future results.
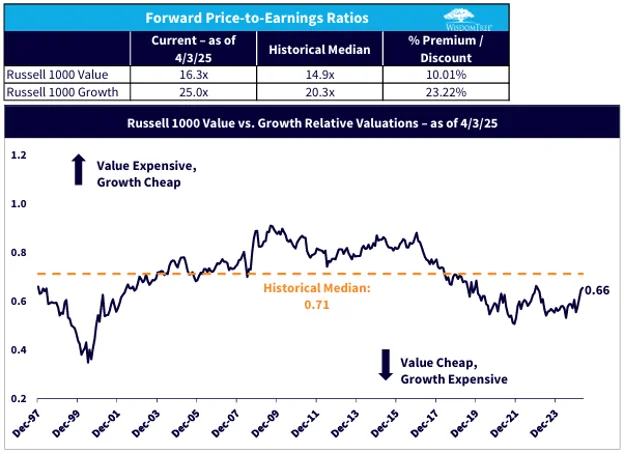
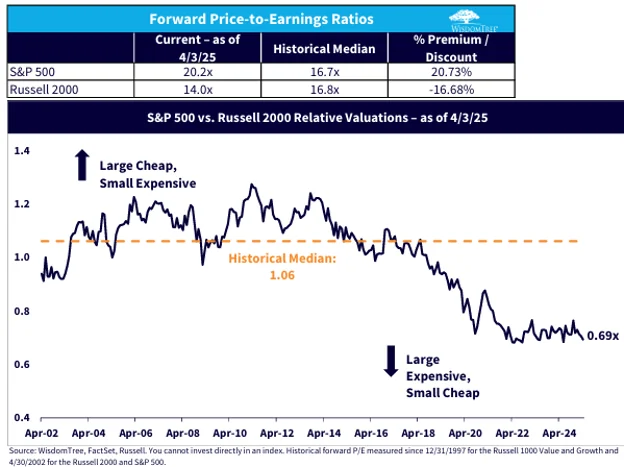
Source for the three previous charts: WisdomTree, through March 2025. You cannot invest in an index and past performance is no guarantee for future results.
Volatility and Momentum
Two other aspects of the equity market are worth noting. The first is volatility. After years of relative complacency and quiescence, the recent tariff pronouncements caused a dramatic spike in volatility (as measured by the “VIX”).
Since, by definition, all long stock positions are short volatility (i.e., their prices go down as volatility goes up), this contributed to the recent market sell-off.
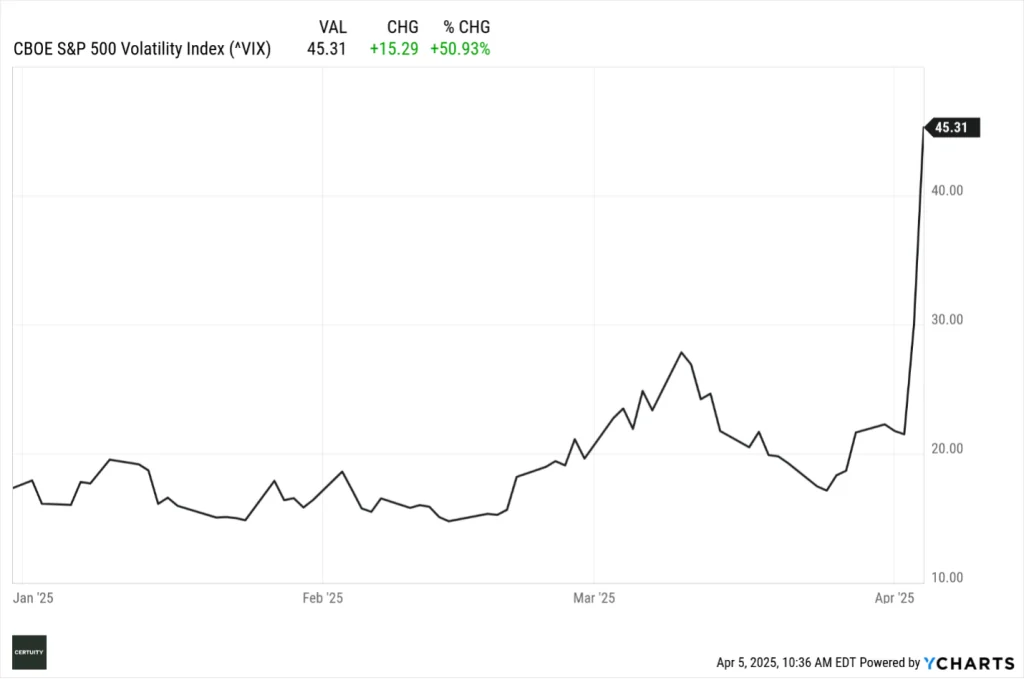
Source: Ycharts, as of April 4, 2025. You cannot invest in an index and past performance is no guarantee of future results.
The second aspect worth noting is market momentum. The market rally of the past 2-3 years was driven primarily by momentum, investor sentiment, and multiple expansion (investors willing to pay more for a dollar of earnings).
A commonly followed measure of market momentum is the “50-day / 200-day” moving average – that is, the relationship between short-term market momentum (the 50-day moving average) and longer-term market trends (the 200-day moving average).
When the 50-day moving average is above the 200-day moving average, that is a bullish signal as it means that market sentiment and momentum are positive.
The reverse is also true – when the 200-day is above the 50-day that is a bearish signal as it means that sentiment is turning over and the market is losing momentum.
When the 50-day “crosses” the 200-day on the way up, that is known as a “golden cross” as it means the market is turning more bullish. Conversely, when the 50-day crosses back downover the 200-day that is called a “death cross” as it means the market is turning bearish.
Note in the following chart that we were in a positive technical environment for most of the past five years, except for during Covid and the horrible market year of 2022, but the market has been positive since then – until now.
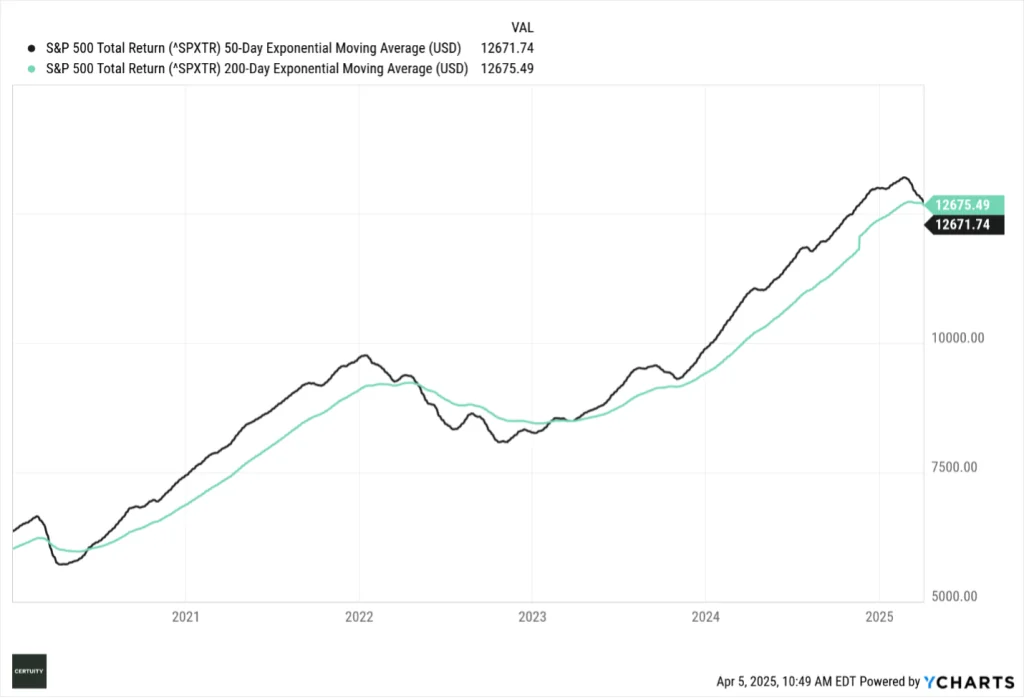
Source: Ycharts, data through April 4, 2025. Past performance is no guarantee of future results.
Interest Rates and Spreads
We discussed the level and shape of the curve above, but what about credit spreads?
As we anticipated, spreads have widened recently (especially in high yield) but remain low by historical standards. Corporate balance sheets remain (generally) in solid shape, though there are signs of increased delinquency and default rates.
Despite the recent decline in rates due to the “risk off” flight to quality trade, we don’t believe rates will remain as low as their current levels, and that general market pressure will eventually return to upward rather than further downward. As such, we continue to hold modest expectations for the total return potential of public bonds.
Given the shape of the yield curve, investors are still not being appropriately compensated for taking excessive duration (interest rate) risk as the yields on short-term bonds are still roughly the same as longer term bonds. (As indicated in the first chart of this blog, there currently is only a 35-bps difference between the 2-year and 10-year Treasury rates.)
We continue to recommend balancing fixed income exposures between the two in a “barbell” approach as a means of generating acceptable levels of yield while controlling duration risk.
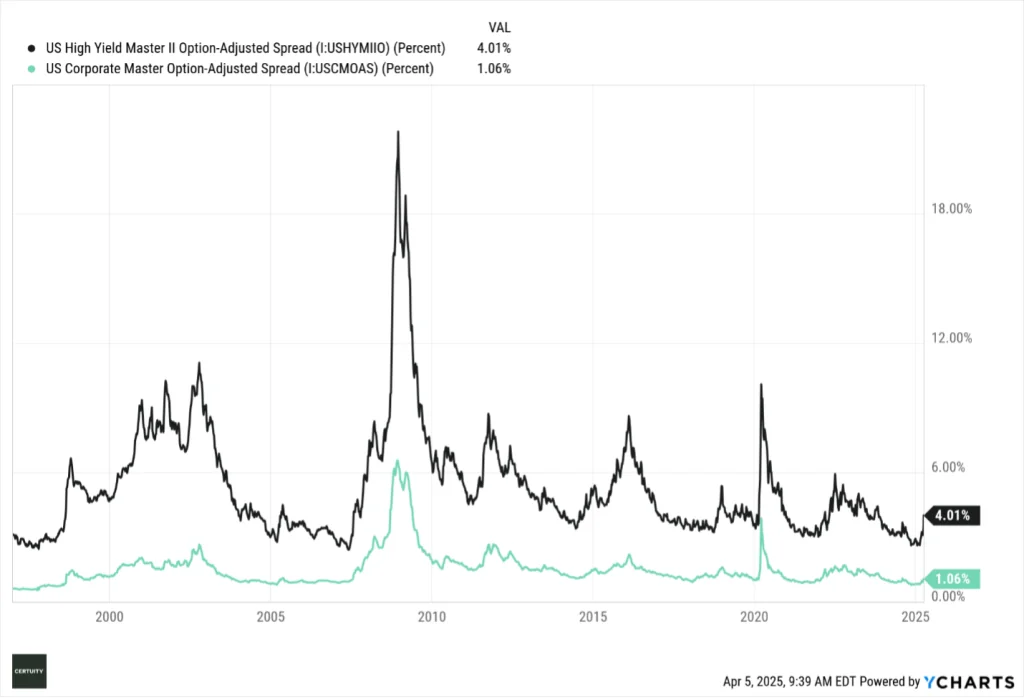
Source: Ycharts, data through April 4, 2025. You cannot invest in an index and past performance is no guarantee of future results.
Summary and Interpretation
When focusing on what we believe are the primary economic and market signals, the “condition our condition is in” is uncertain and volatile, driven by the recently announced tariff policies, unclear economic growth, future Fed policy, the success (or not) of implementing tax and regulatory reforms, and increasing geopolitical tensions.
To summarize our investment views for the remainder of 2025:
- We believe global equity markets will continue to be volatile until we have greater clarity on tariffs and economic growth. But we do not believe this volatility will last forever. At some point, market fundamentals (rather than sentiment and momentum) will matter again, and we may actually see interesting buying opportunities over the next several months and potentially through the remainder of 2025. But we need clarity first.
- There is income available in fixed income, but the total return potential is muted. We continue to favor balancing short-term and longer-term allocations to manage duration risk without sacrificing yield. We prefer investment grade versus high yield bonds at this point in the economic cycle. Investors seeking higher yields should consider the private credit market versus bank loans or public high yield bonds.
- Fundamental and strategic asset class rotation investors should look at the relative value attractiveness of US value and non-US allocations. We are bullish longer-term on smaller cap stocks, but it may be too early to make that trade just yet.
- Active management and intelligent risk factor tilts should be rewarded versus passive management as we move through 2025.
- We continue to like the private markets for those investors who can access them. Larger cap direct middle market private credit lending may be getting “crowded” due to heavy investor inflows, but more opportunistic market niches continue to present interesting opportunities.
- Specific private equity segments – secondaries, energy infrastructure, venture capital, and sports investing – seem to be offering interesting opportunities.
- We have an active search on for multi-strategy hedge fund solutions, as we believe the current market regime is favorable for lower correlated and more diversifying strategies.
- As always with alternative and private market investments, manager selection is critical to longer-term success.
As philosophically strategic investors, we continue to recommend focusing on a longer-term time horizon and the construction of “all-weather” portfolios, diversified at both the asset class and risk factor levels.
Now is the time for patience, discipline, and a focus on longer-term investment objectives.
We hope you find this helpful and, as always, we welcome your feedback and questions.